Maps
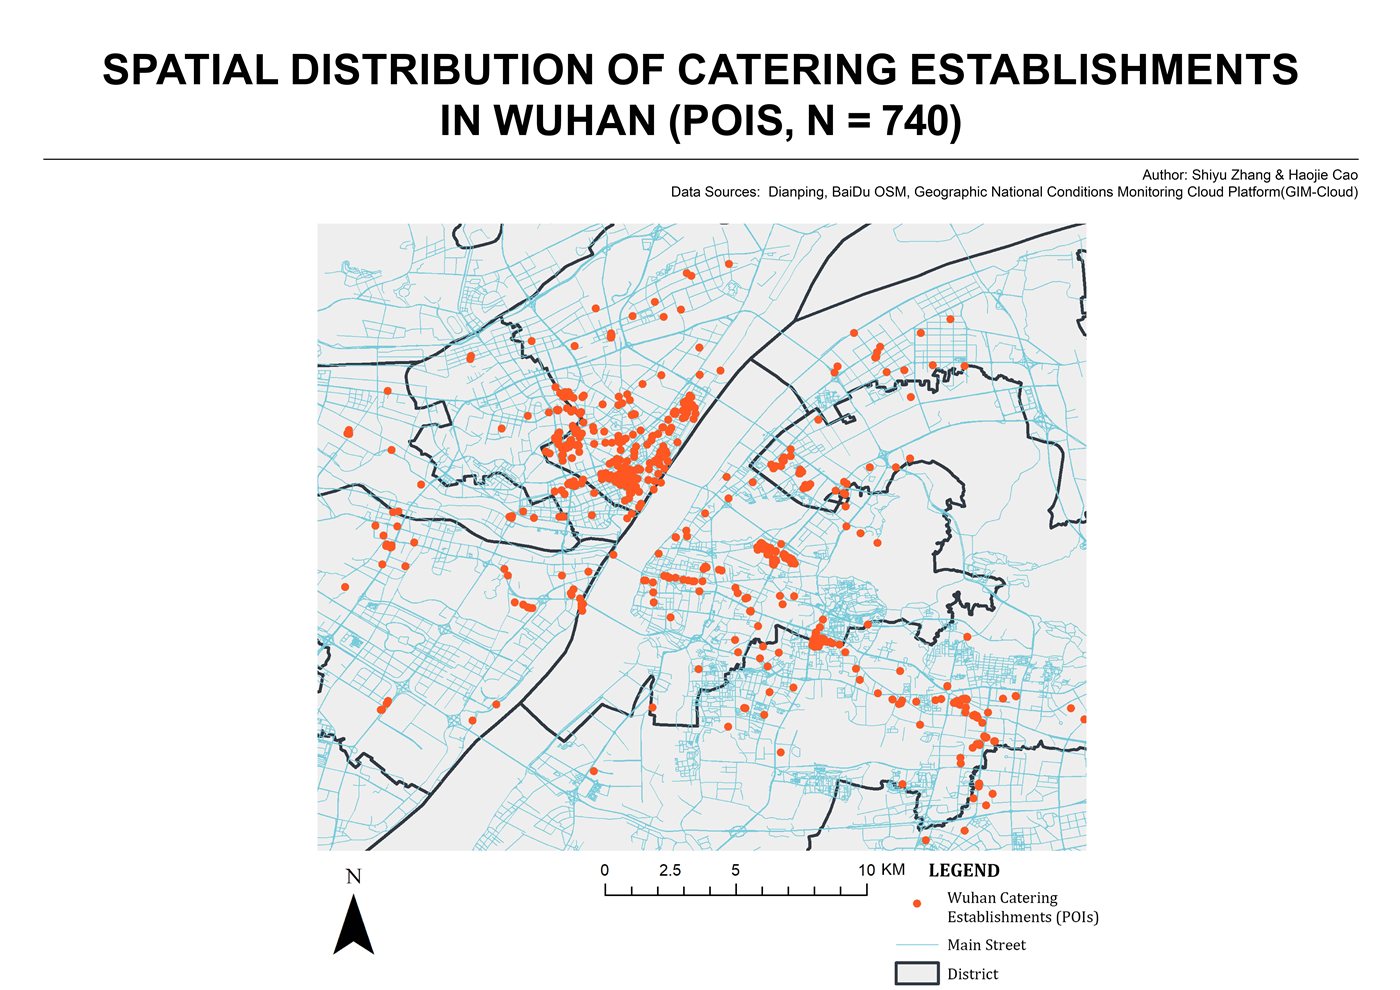 ⊕
Point distribution of 740 catering establishments across central Wuhan, based on POI data collected from OpenStreetMap.
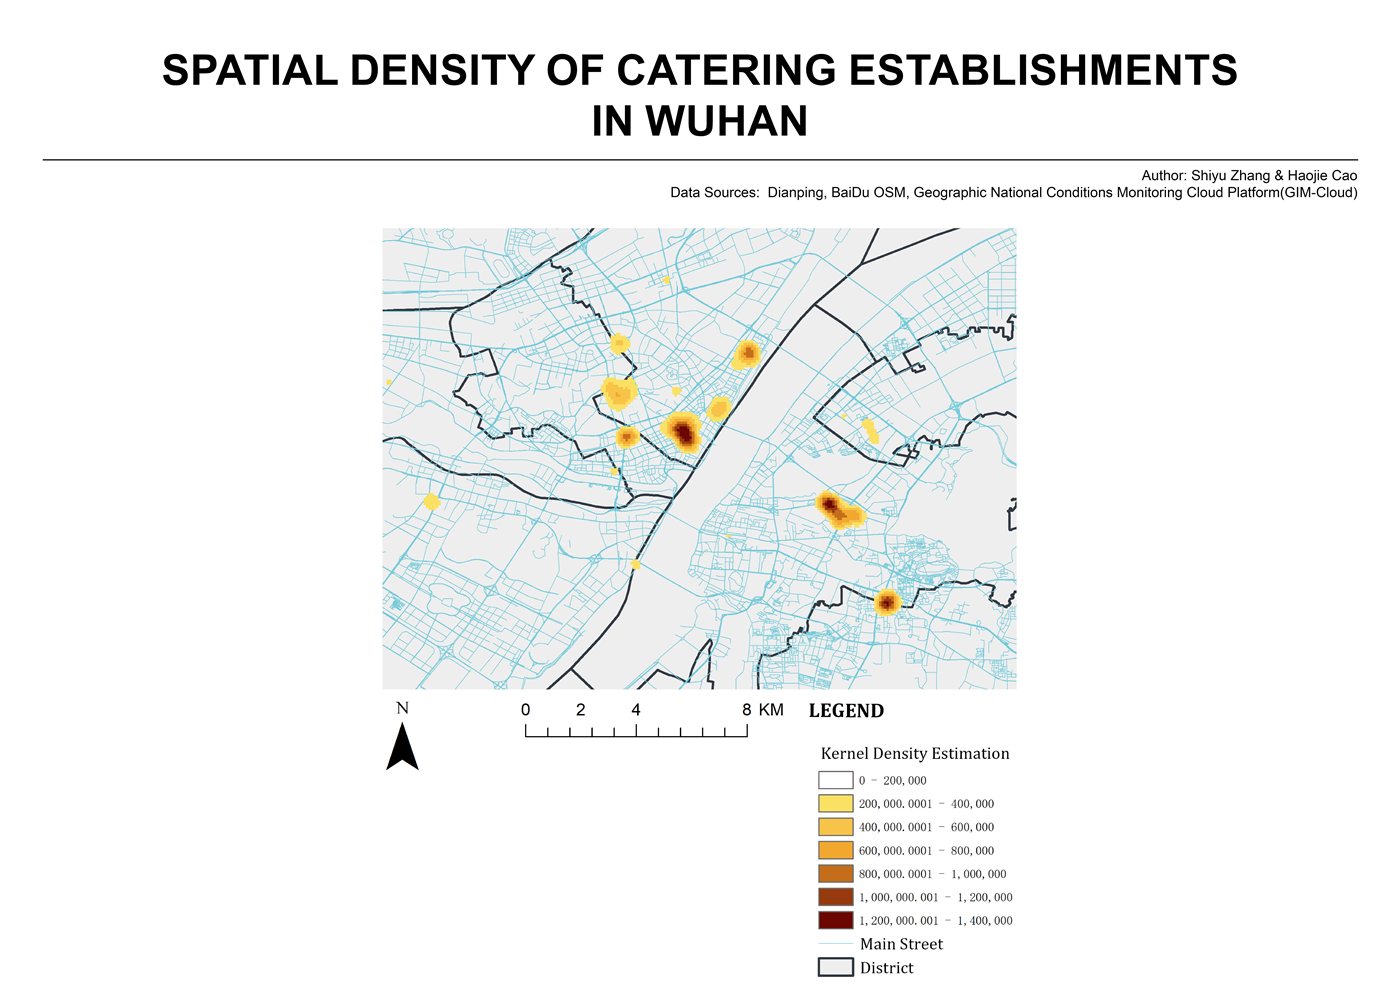 ⊕
Kernel density surface showing areas with higher concentrations of catering establishments across Wuhan's urban core.
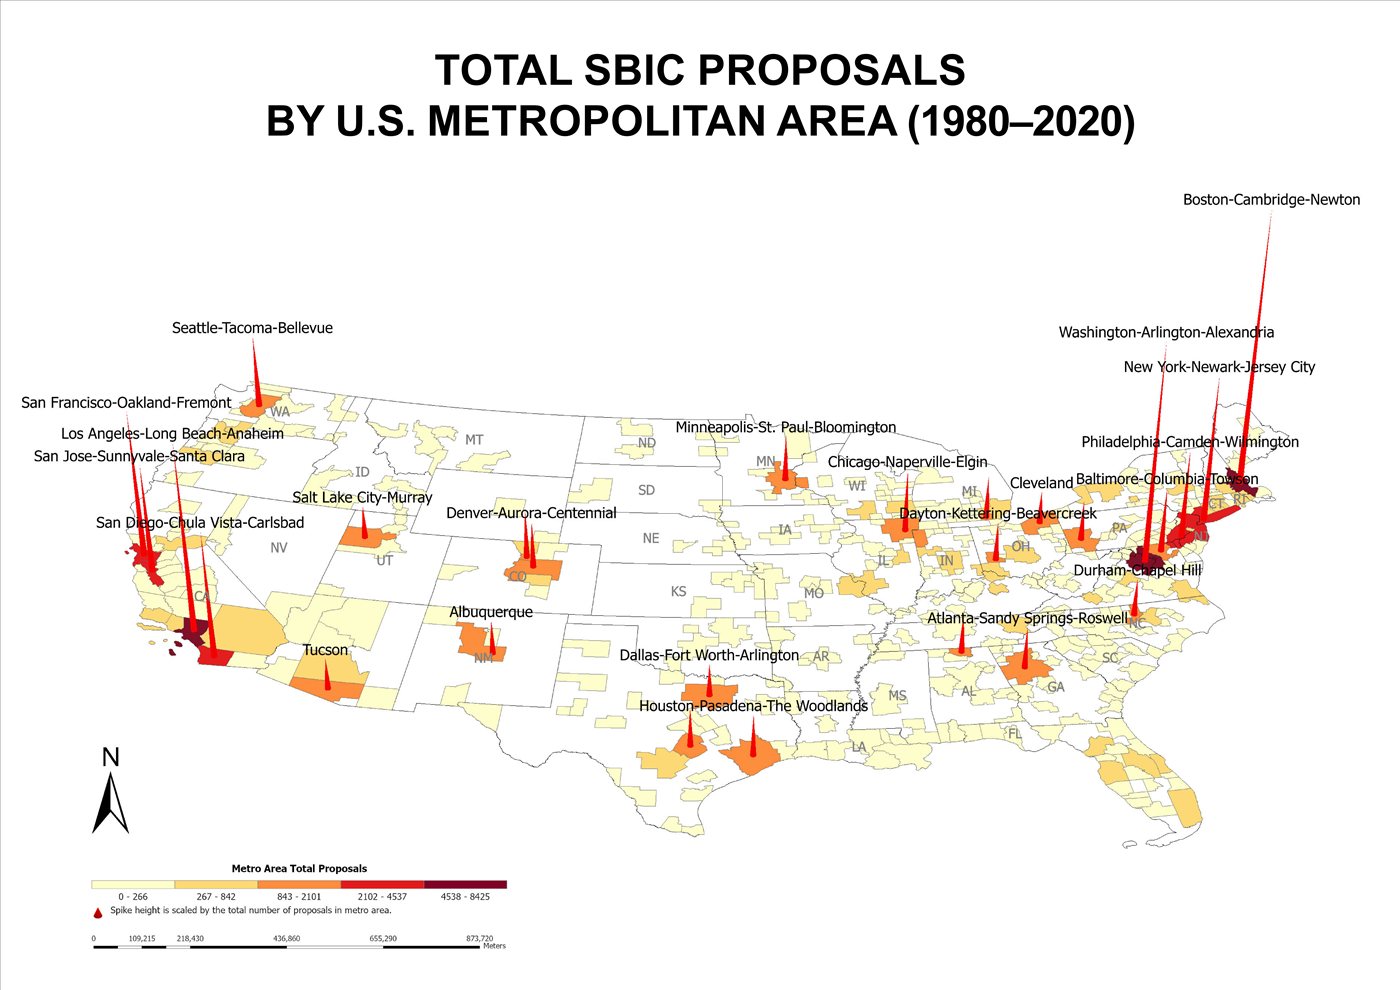 ⊕
Spatial distribution of total SBIC proposal counts across U.S. metropolitan areas, showing clusters of higher proposal counts in several coastal metro areas.
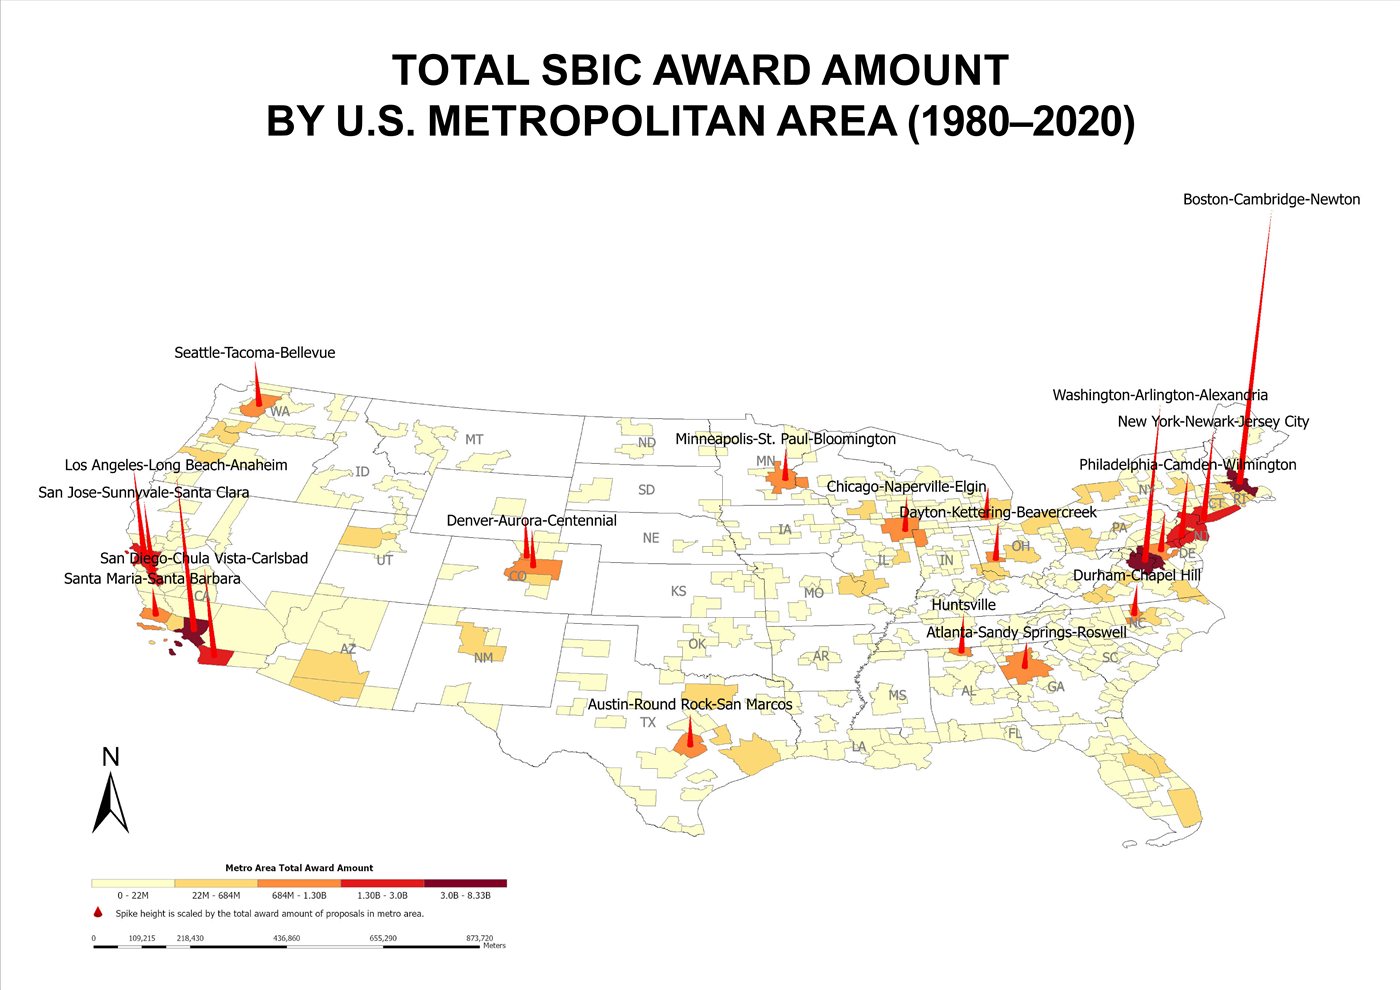 ⊕
Cumulative SBIC funding across U.S. metropolitan areas from 1980–2020, highlighting persistent geographic disparities in investment.
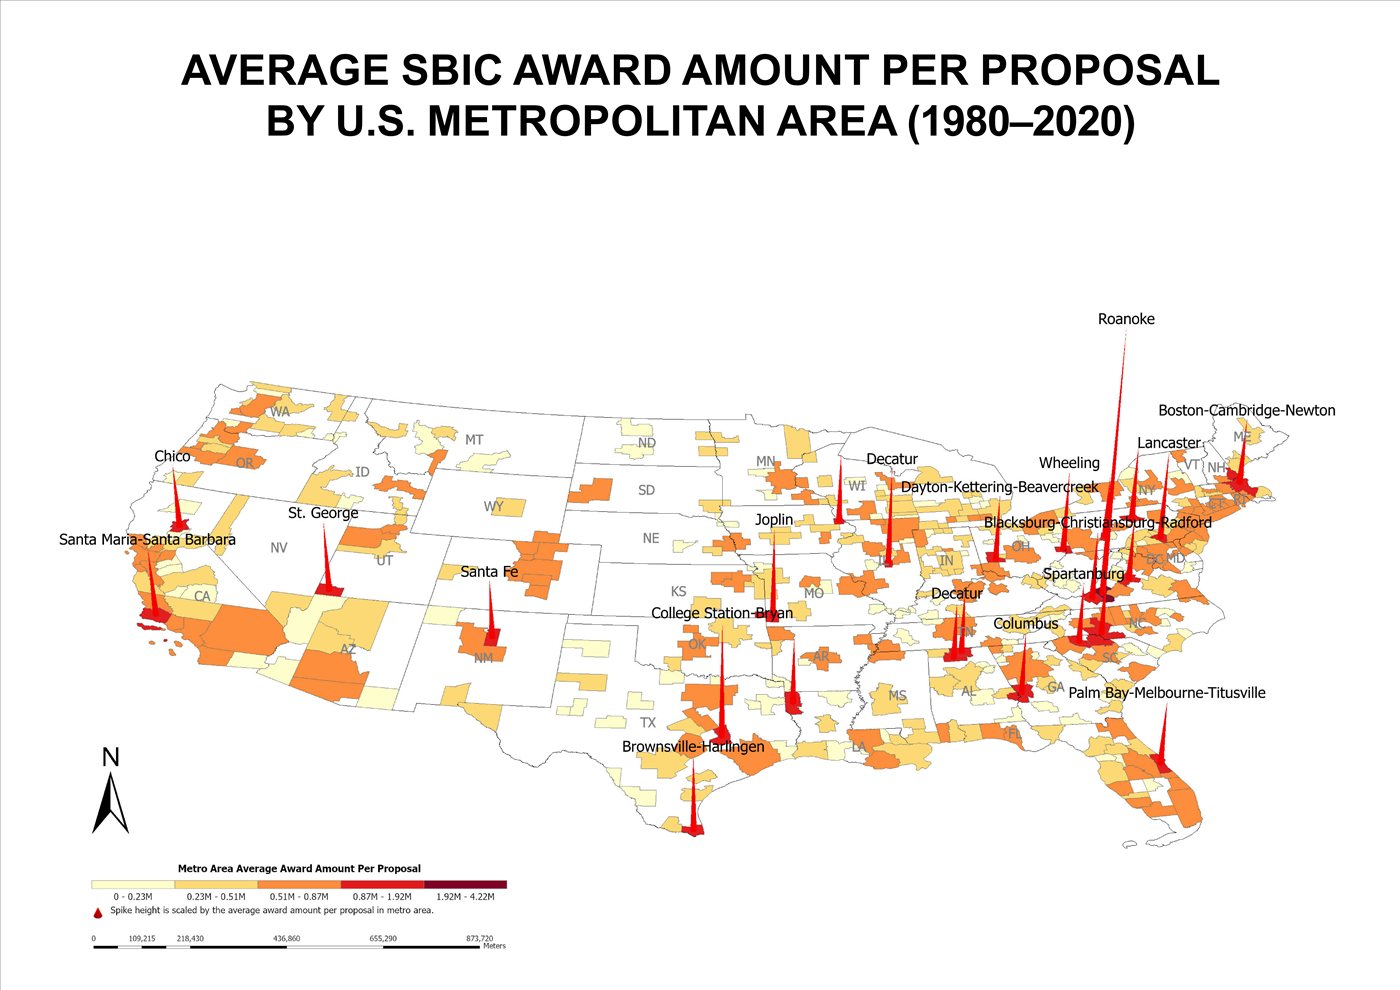 ⊕
Average SBIC funding per proposal across U.S. metropolitan areas, shown using a combined choropleth and spike map.
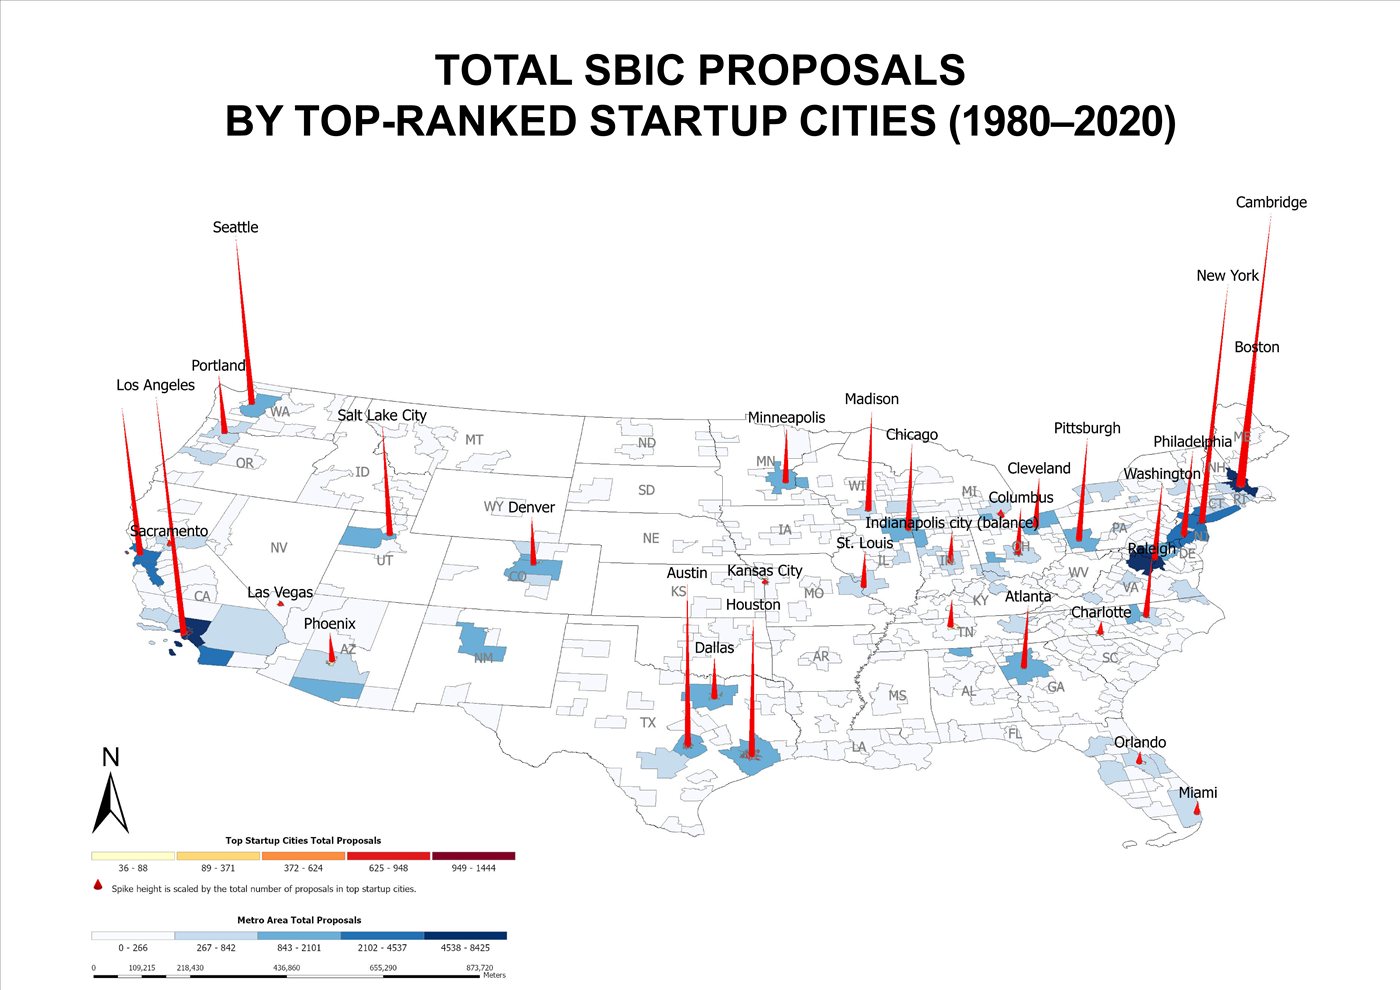 ⊕
Spatial distribution of SBIC proposal counts in top-ranked Startup cities, shown within their broader metropolitan contexts.
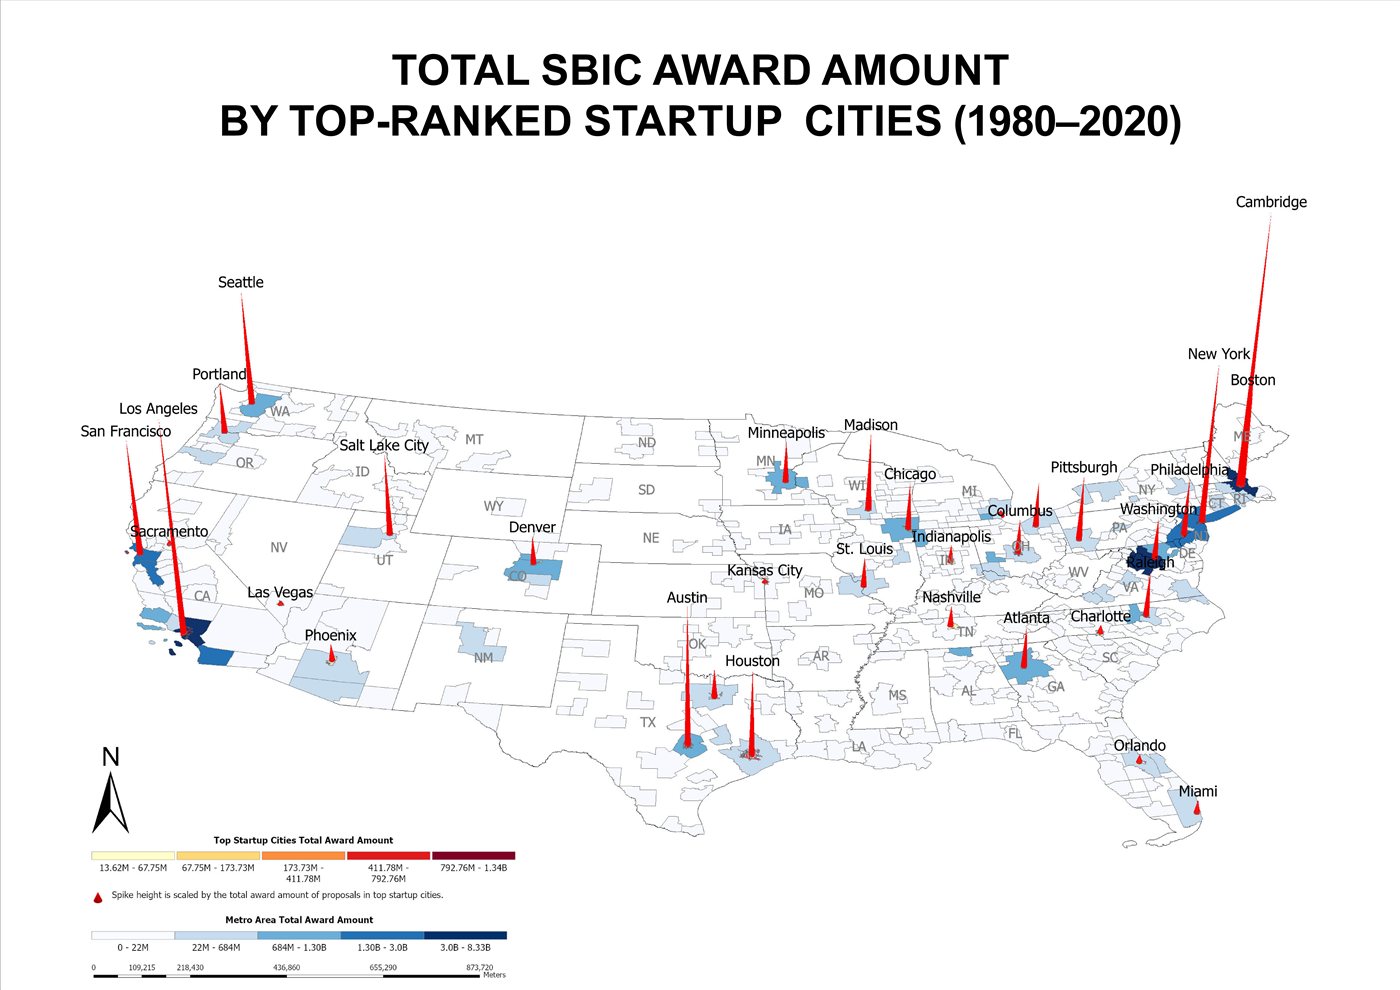 ⊕
Cumulative SBIC funding received by top-ranked Startup cities, shown within their broader metropolitan contexts.
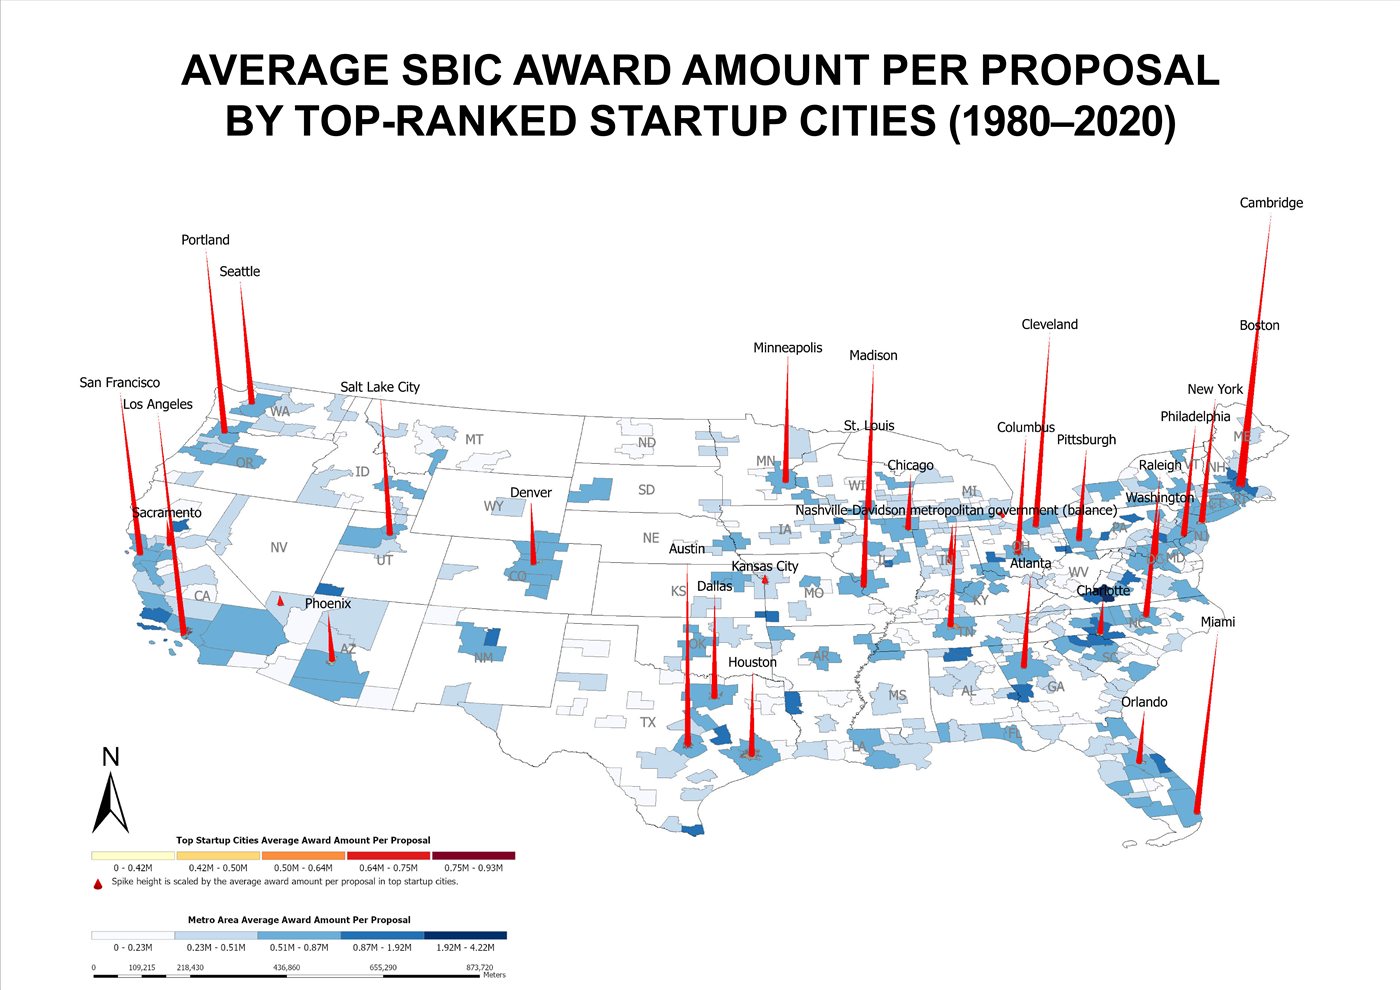 ⊕
Average SBIC award amount per proposal in top-ranked Startup cities, compared with their surrounding metropolitan areas.
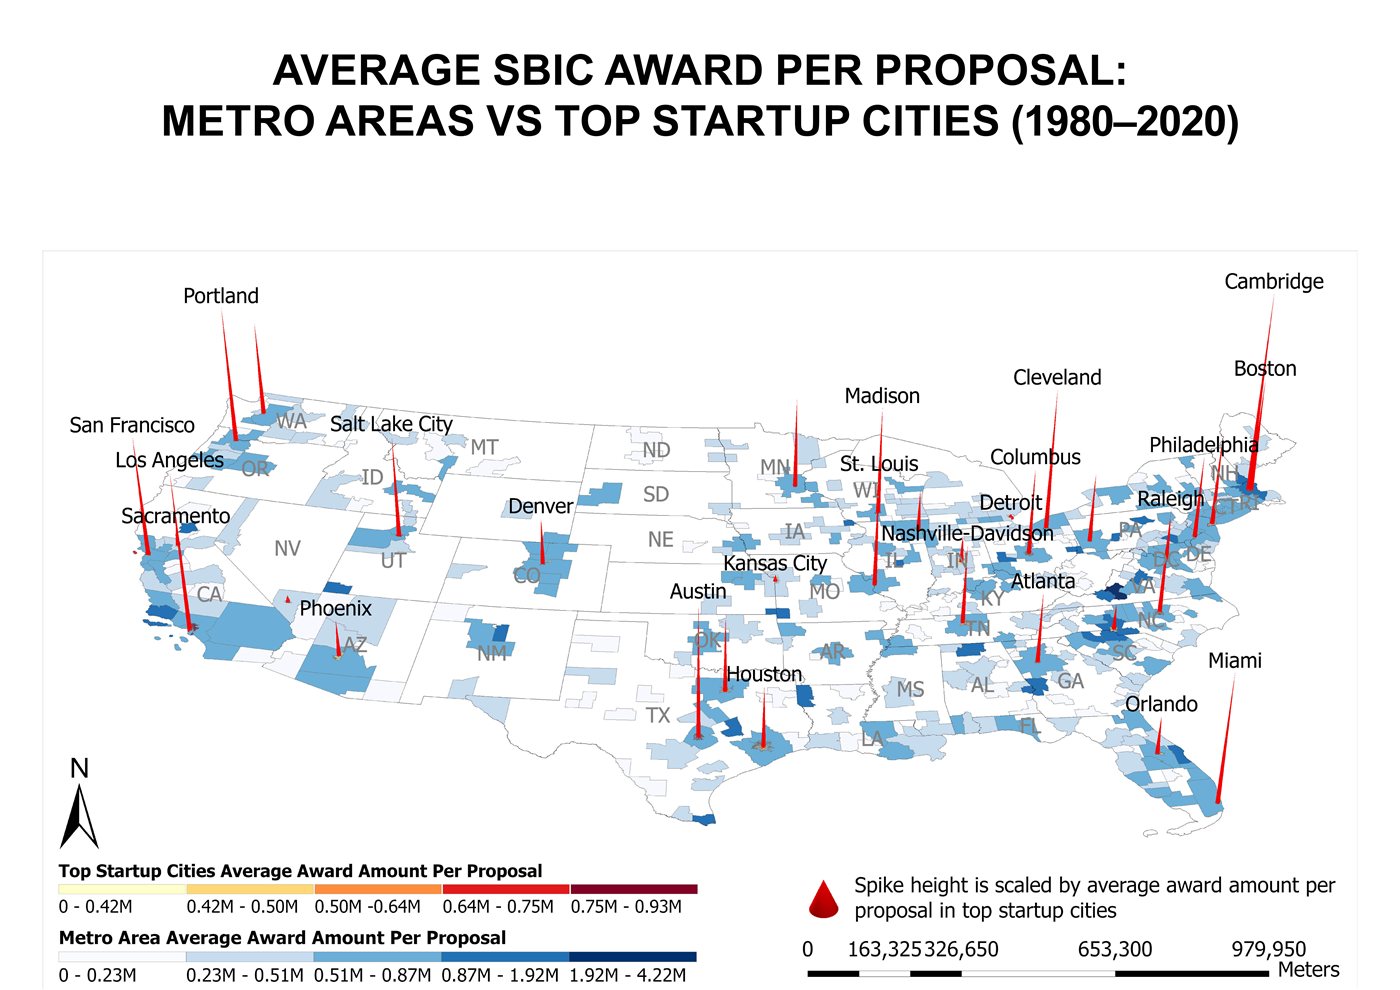 ⊕
Comparative map showing average SBIC award per proposal in metropolitan areas alongside top startup cities.
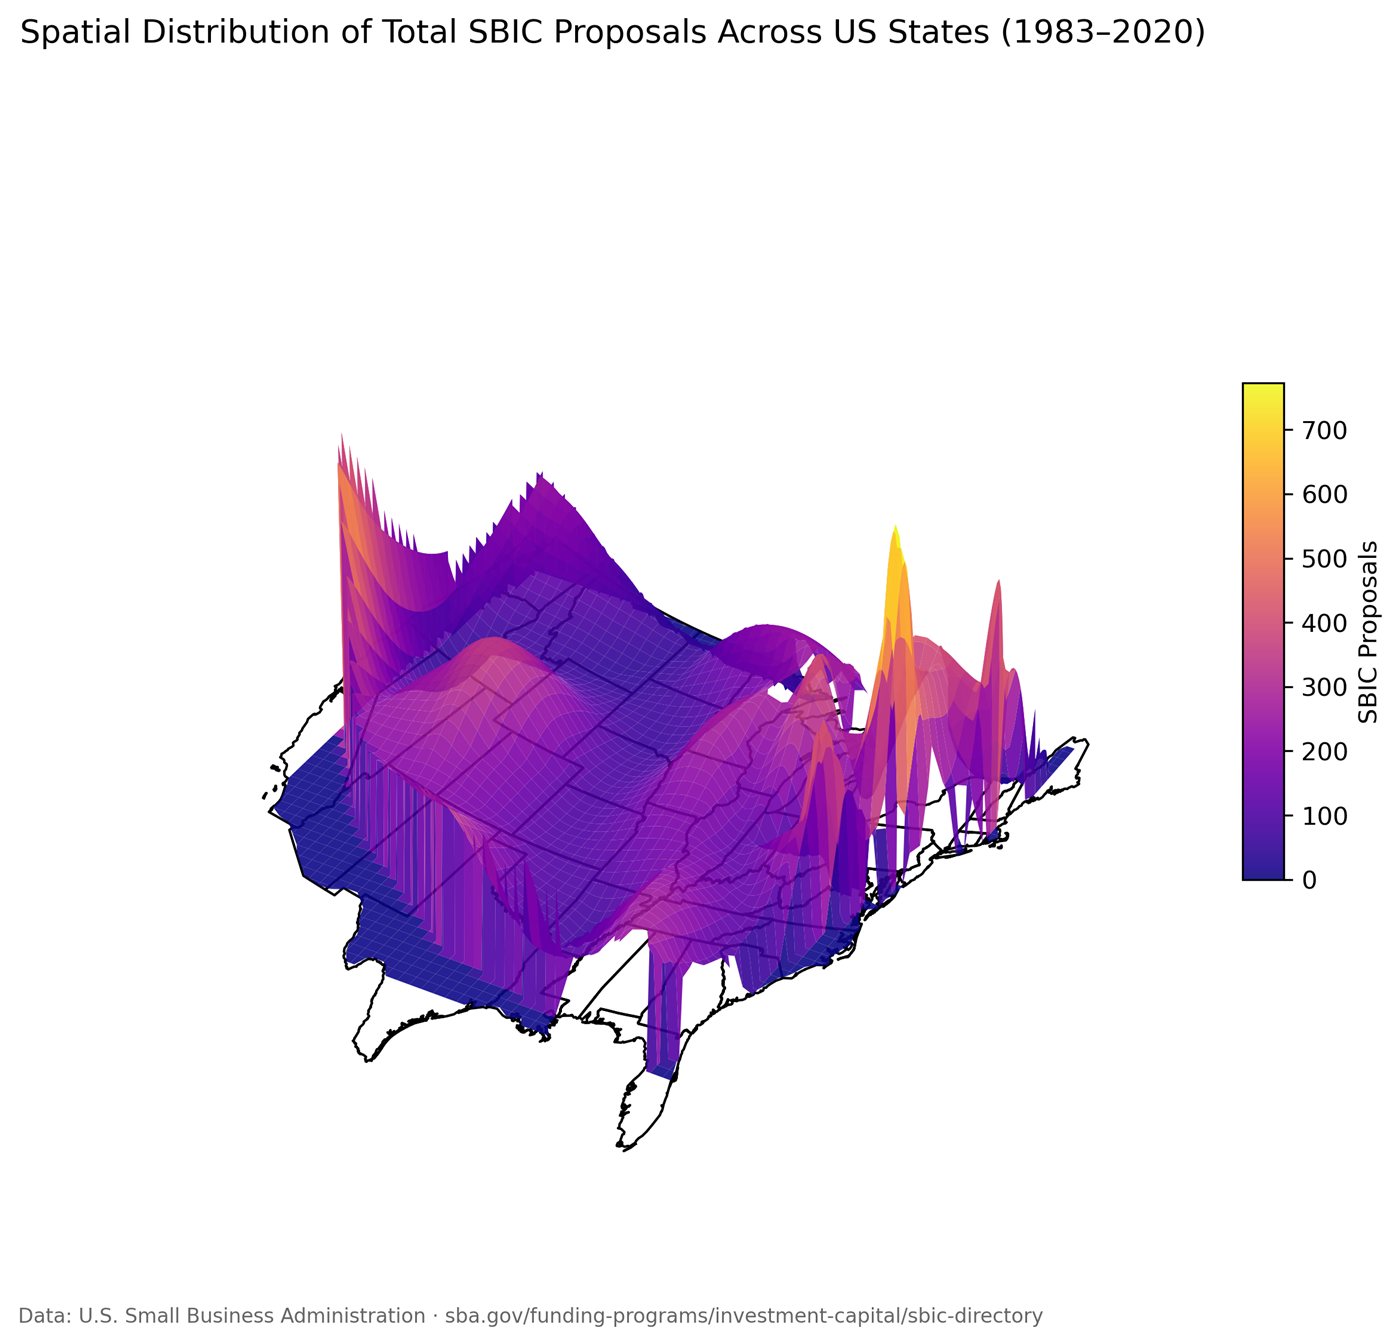 ⊕
Spatial distribution of total SBIC proposals across U.S. states from 1983 to 2020.
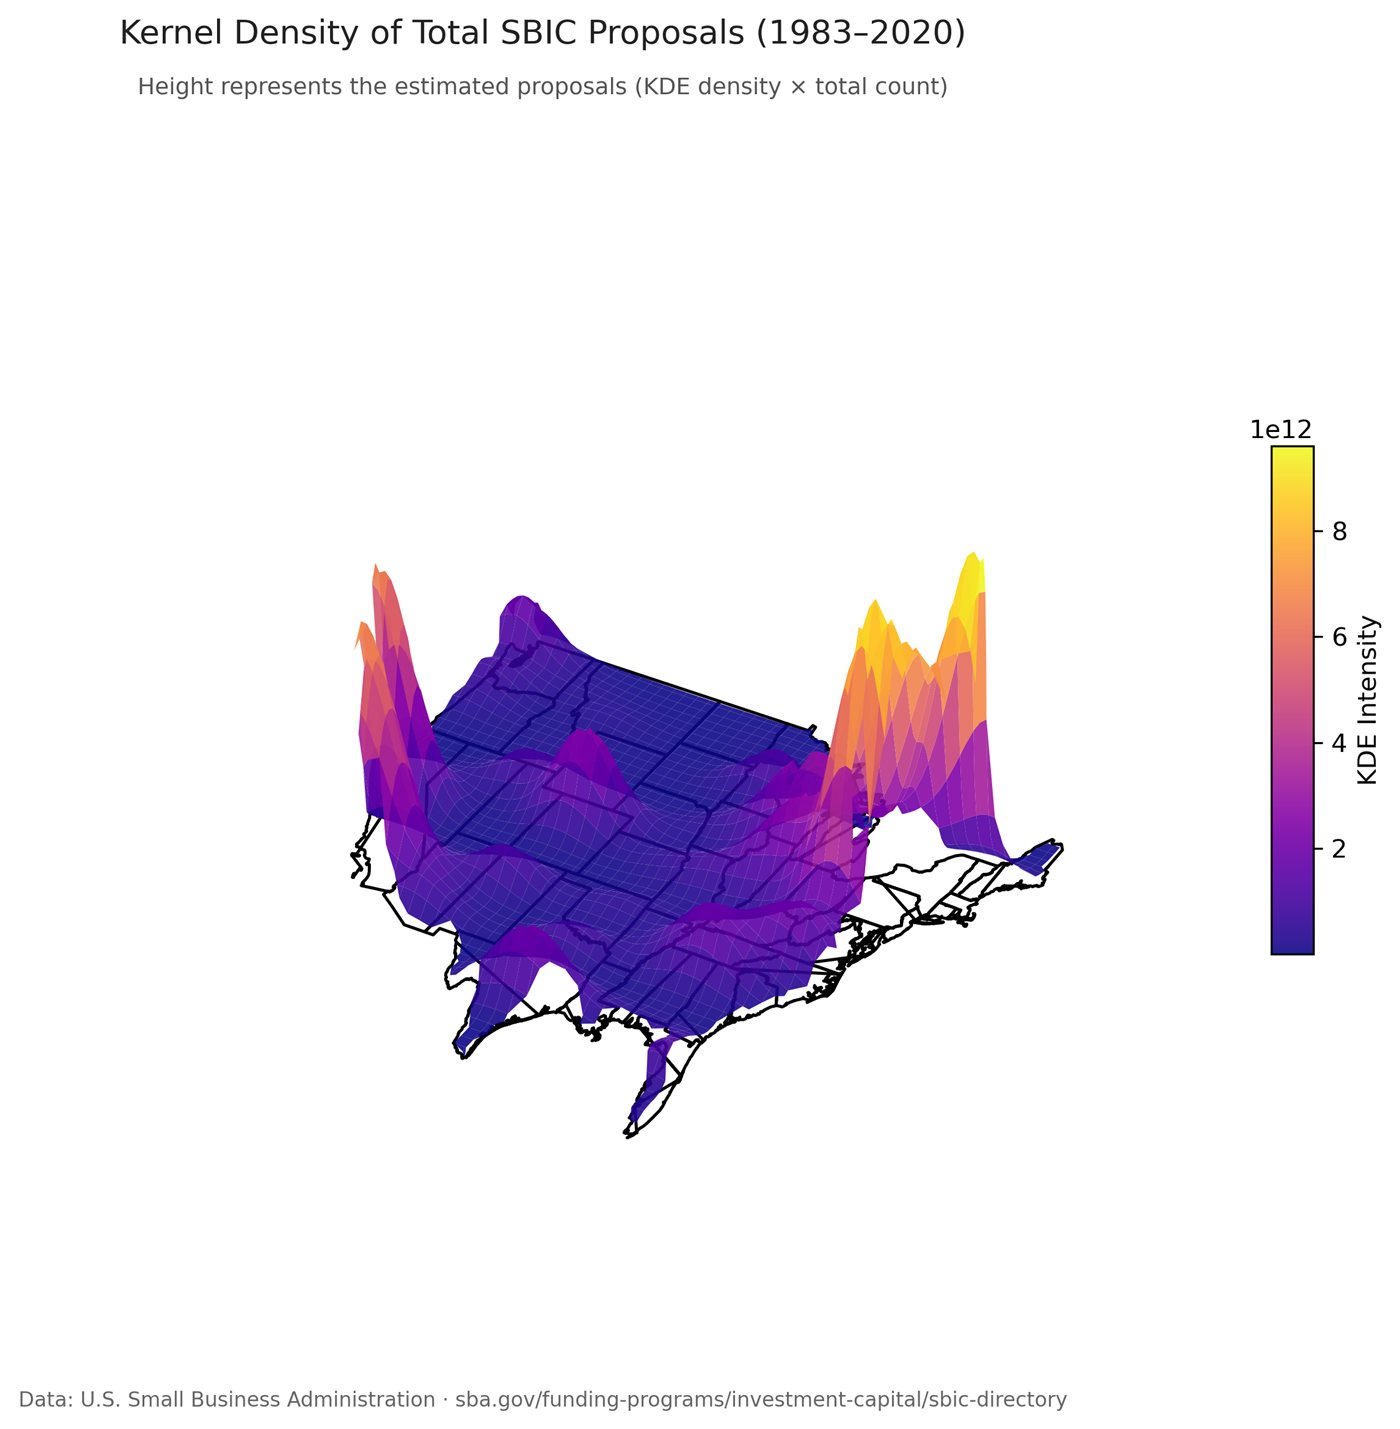 ⊕
Kernel density estimation highlighting the spatial concentration of SBIC proposals across the United States.
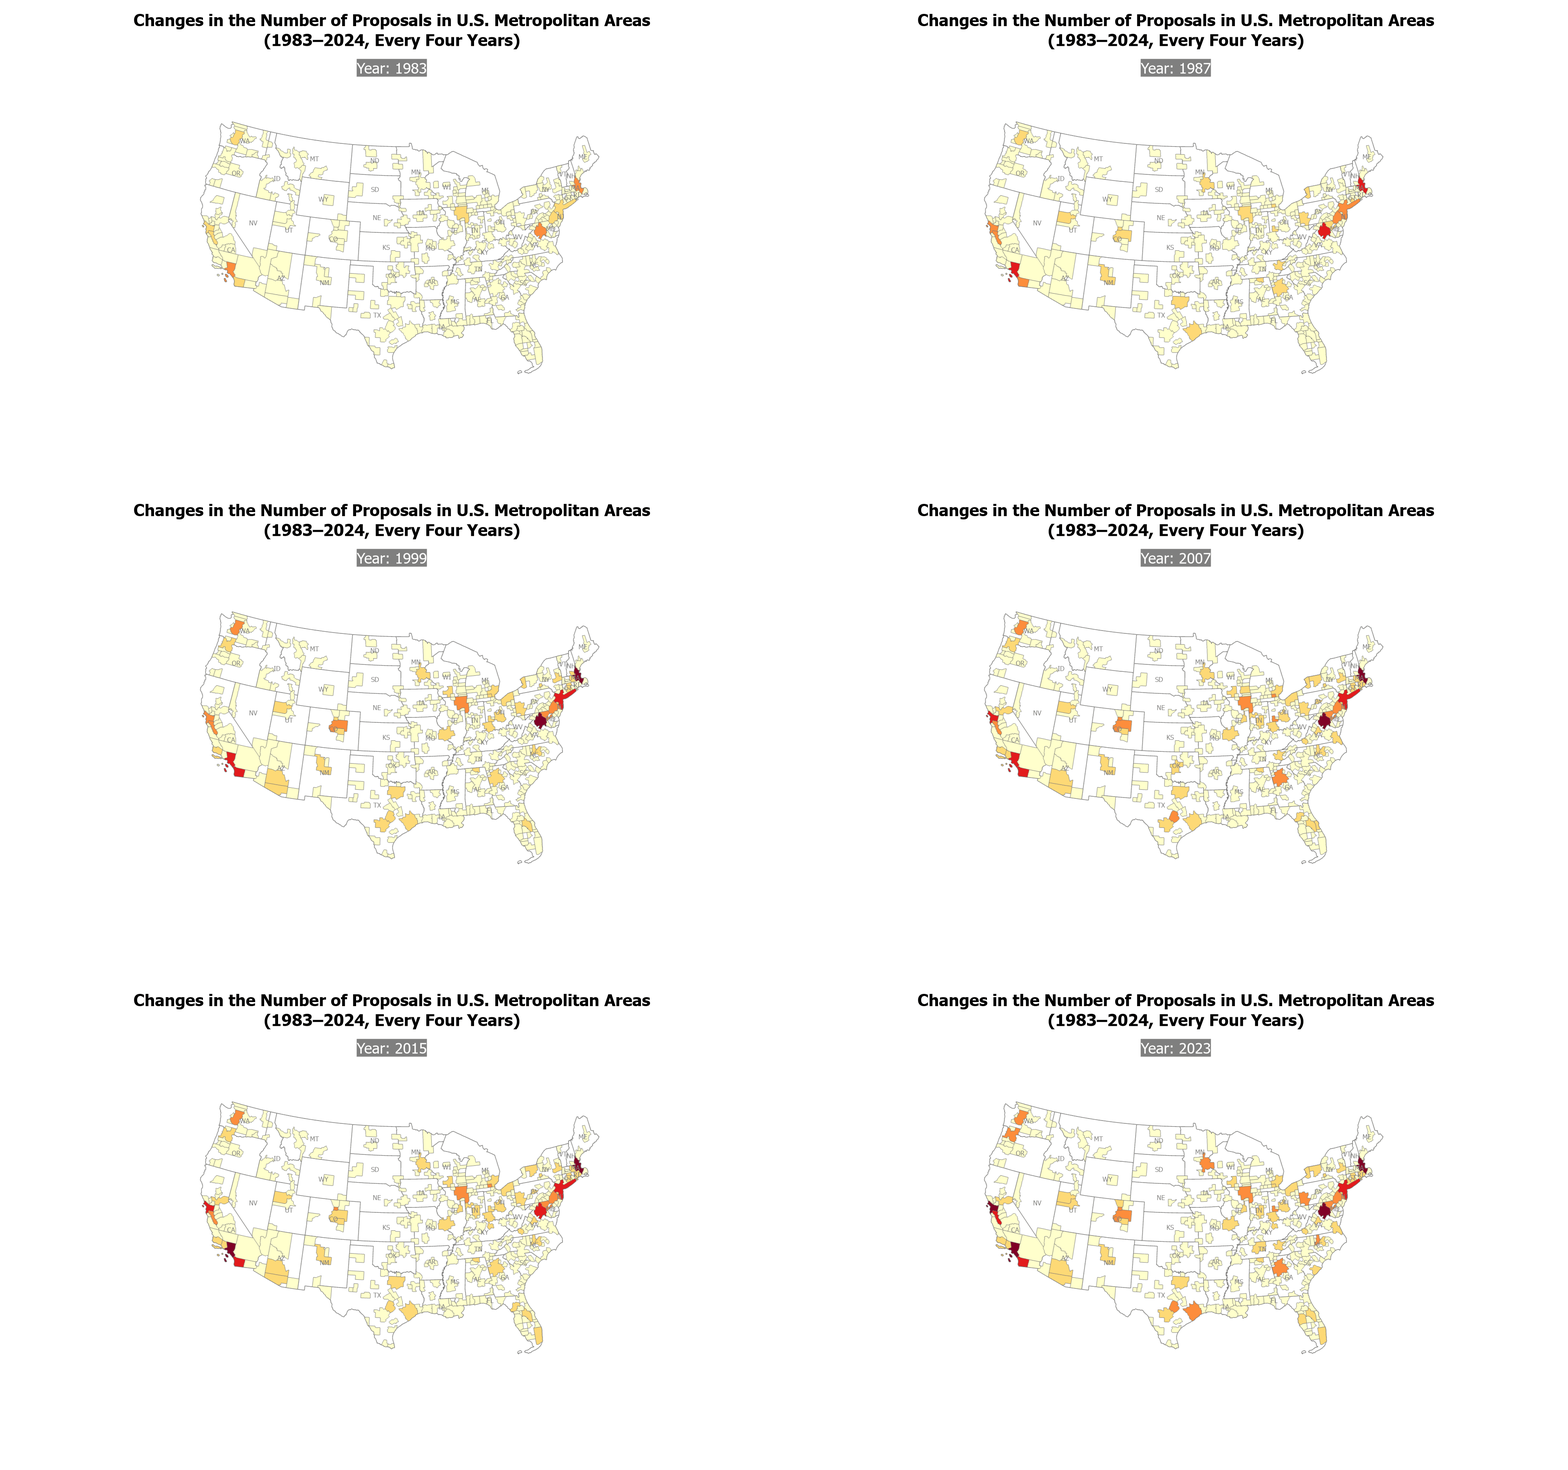 ⊕
Choropleth animation showing the number of SBIC proposals received by each U.S. metropolitan area at four-year snapshots from 1983 to 2024.
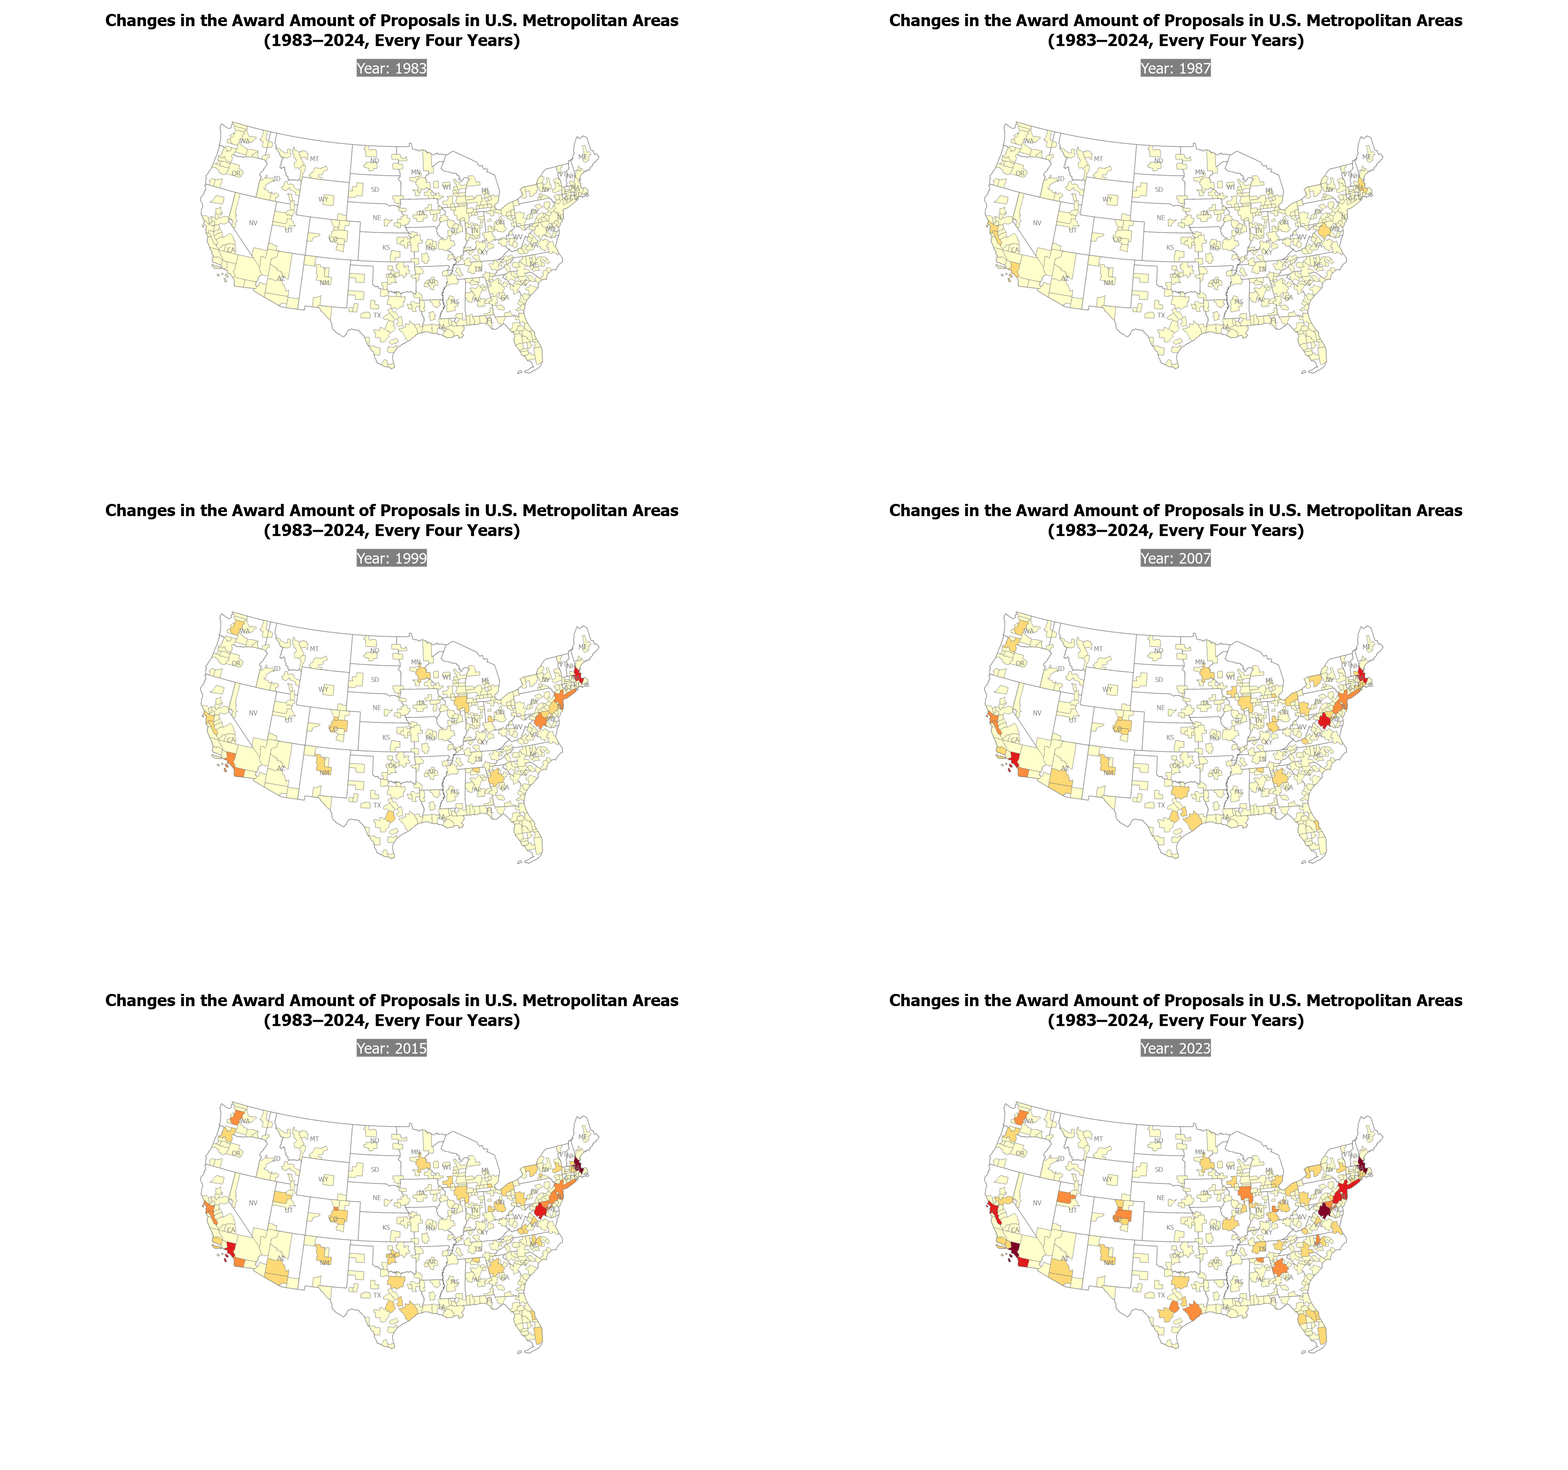 ⊕
Choropleth animation tracking total SBIC award amounts disbursed to each U.S. metropolitan area at four-year intervals from 1983 to 2024.
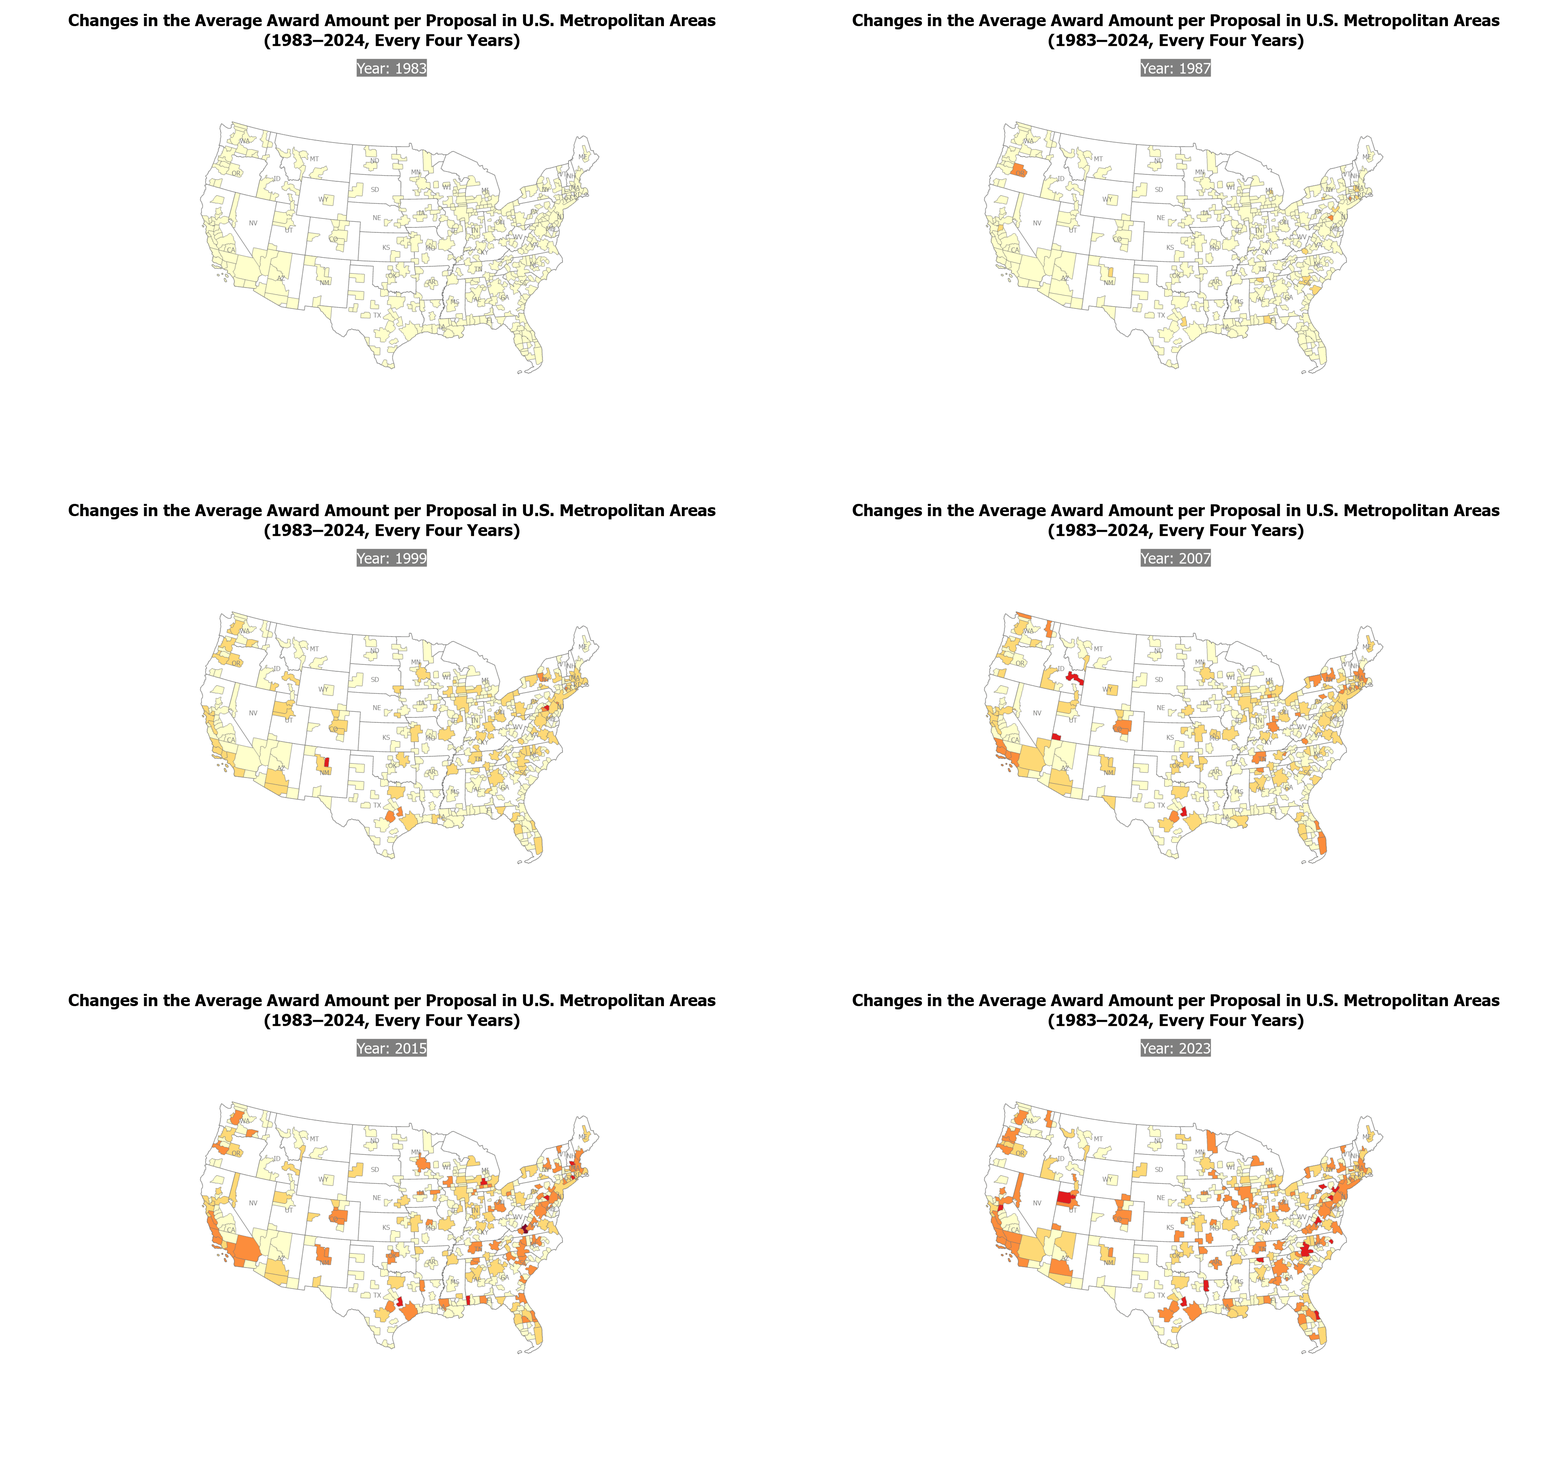 ⊕
Choropleth animation displaying the average SBIC award per proposal for each U.S. metropolitan area at four-year intervals from 1983 to 2024.
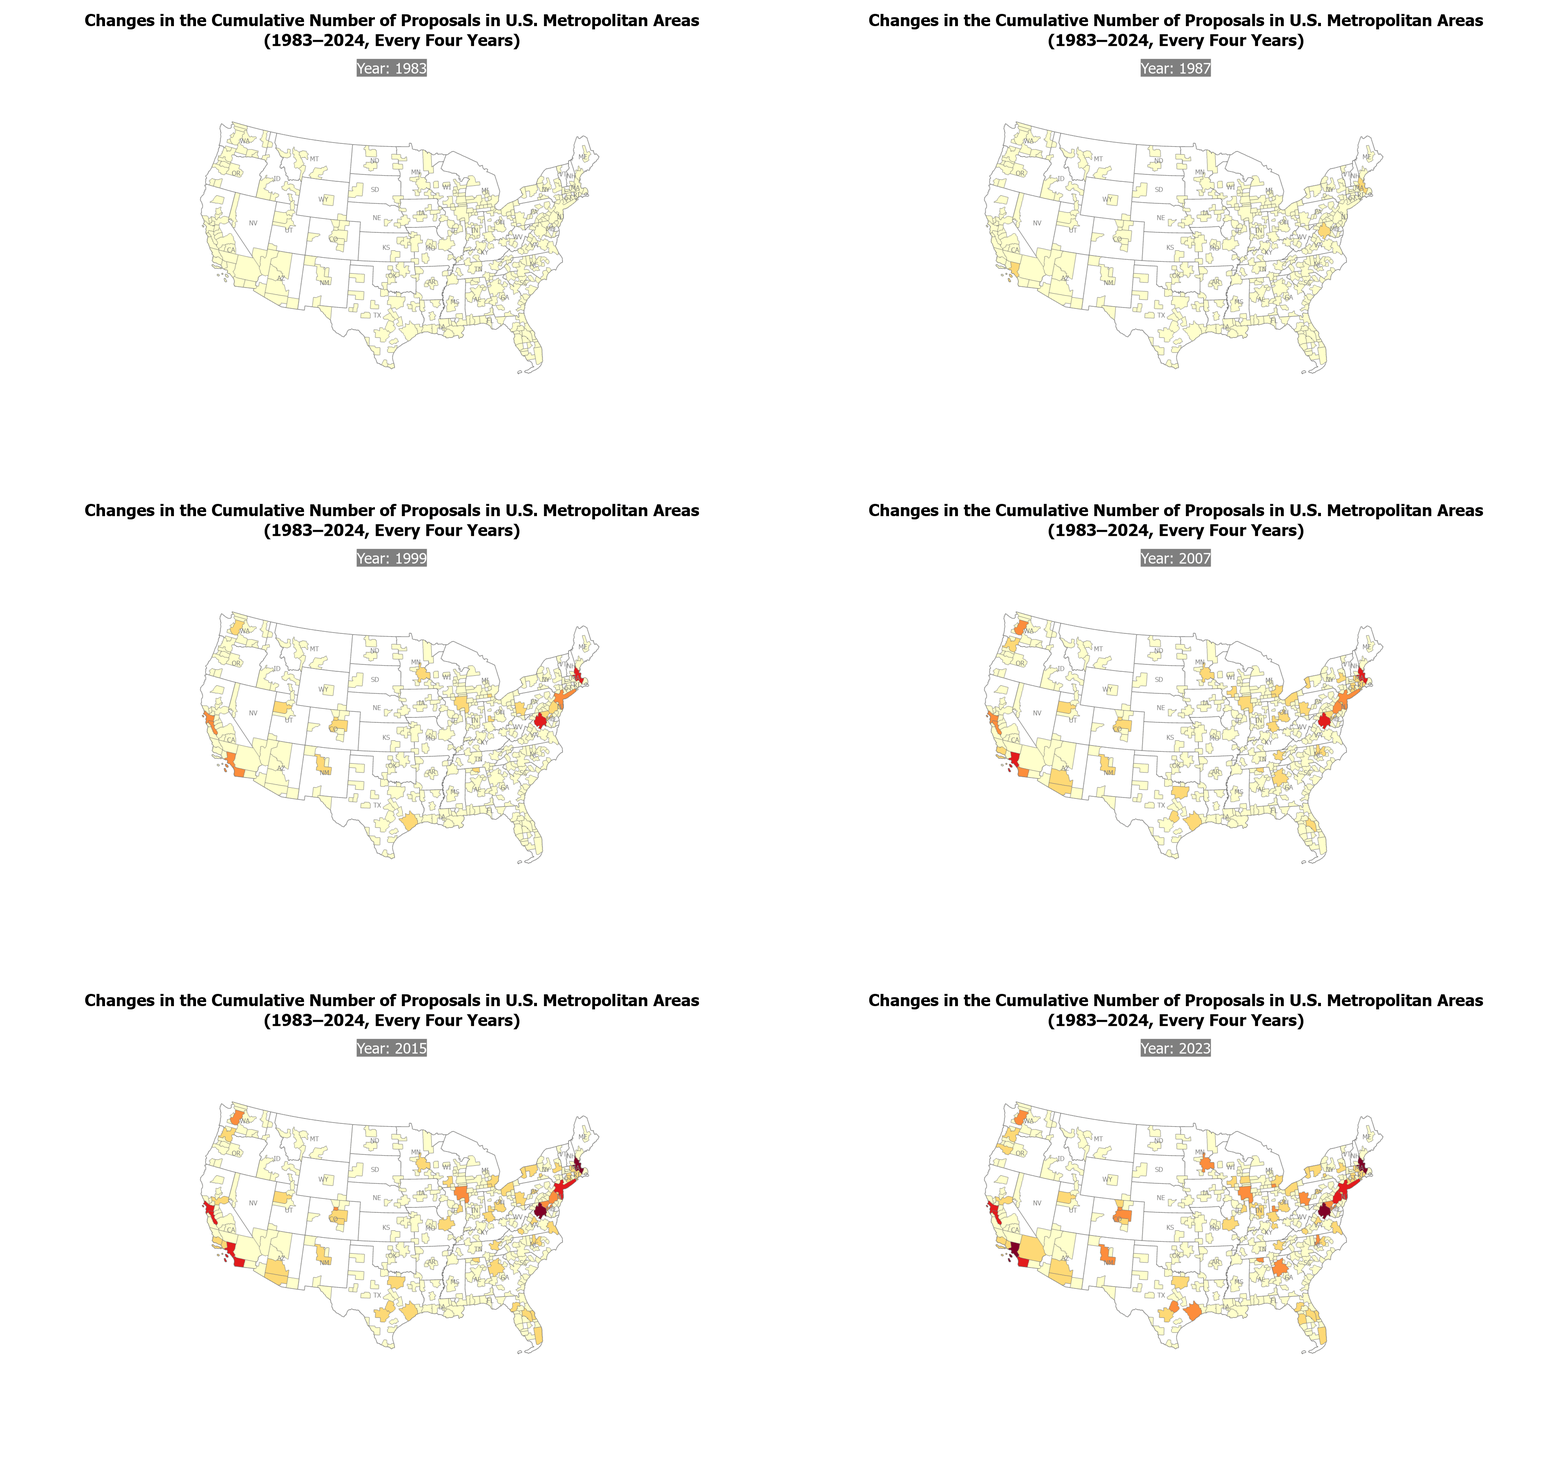 ⊕
Choropleth animation tracking the running total of SBIC proposals received by each U.S. metropolitan area from 1983 to 2024, updated every four years.
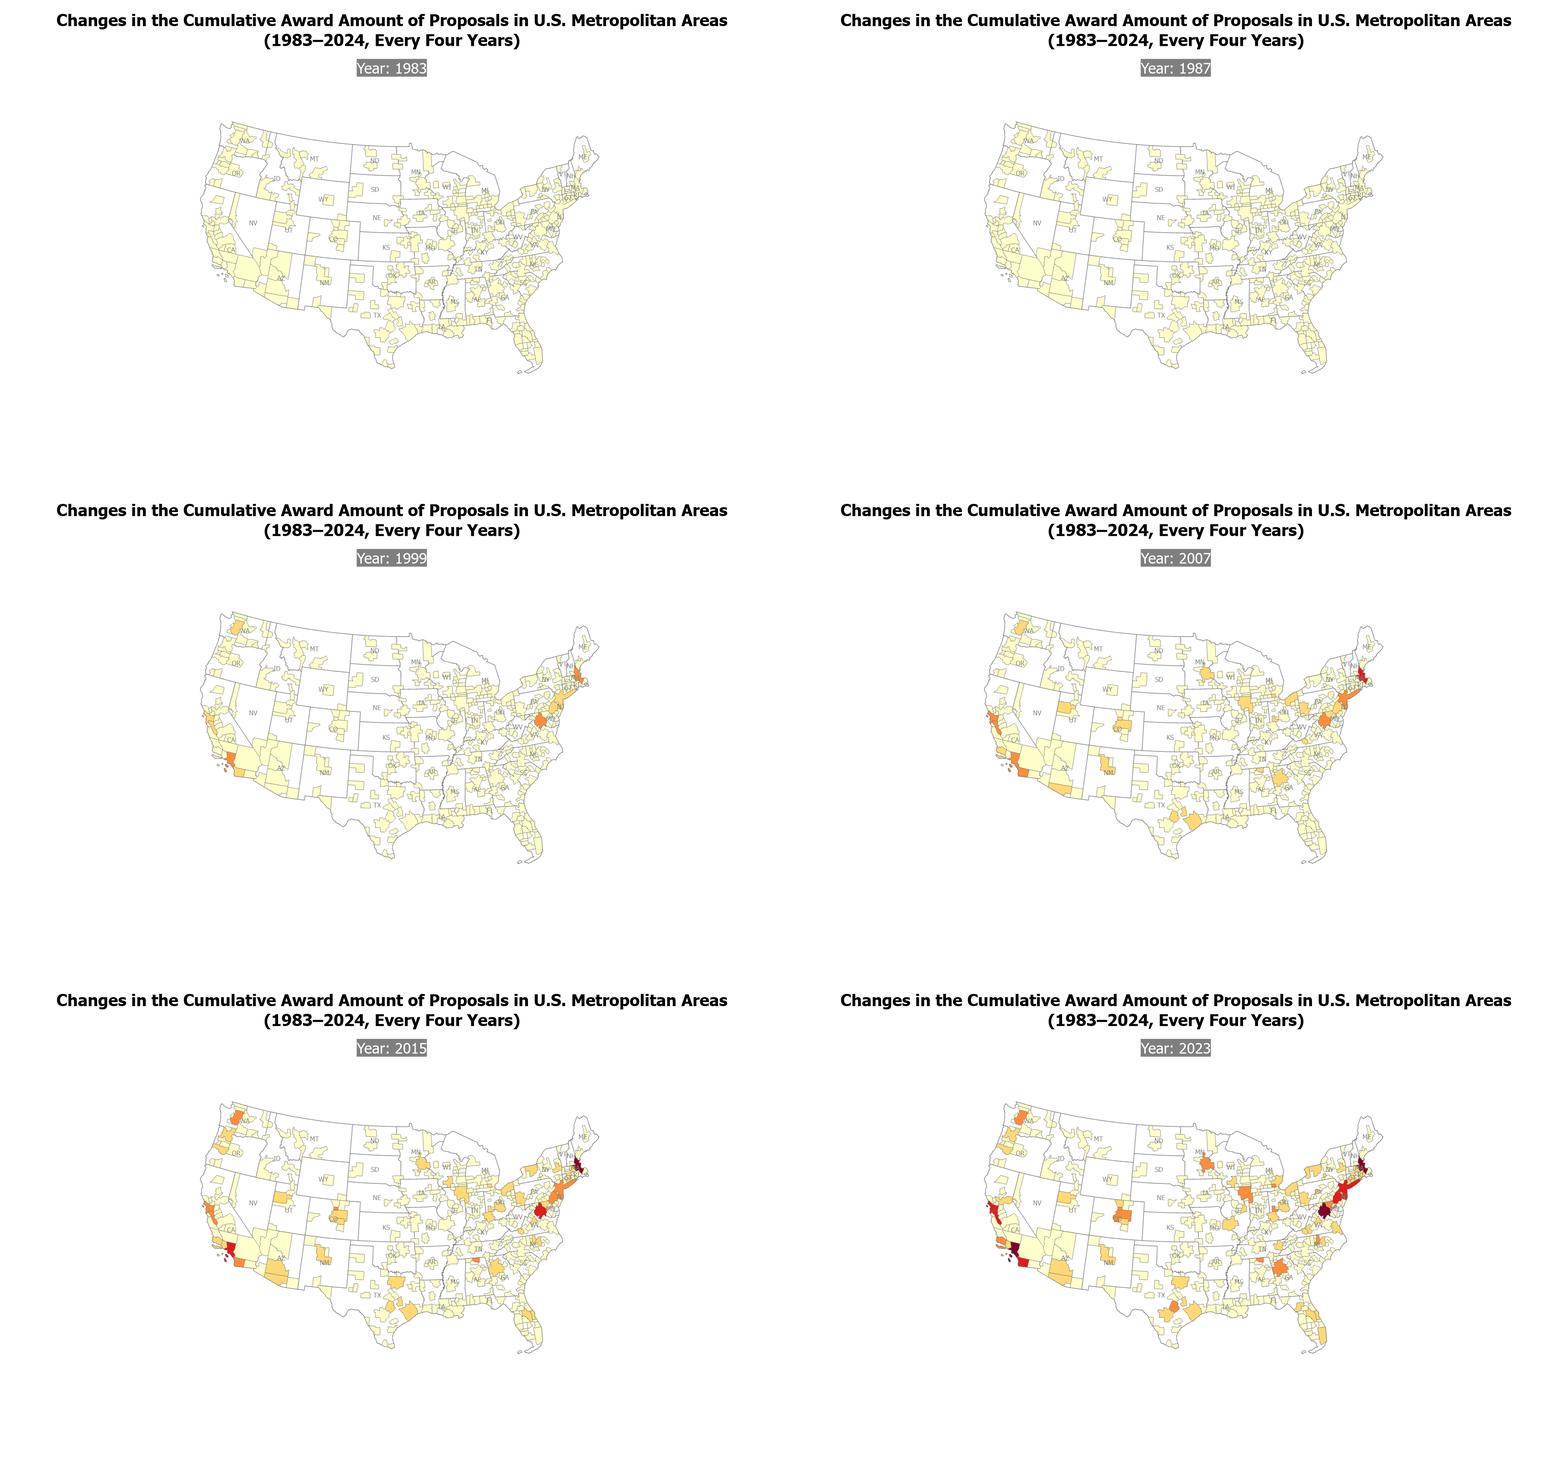 ⊕
Choropleth animation showing cumulative SBIC award amounts channeled into each U.S. metropolitan area from 1983 to 2024, updated every four years.
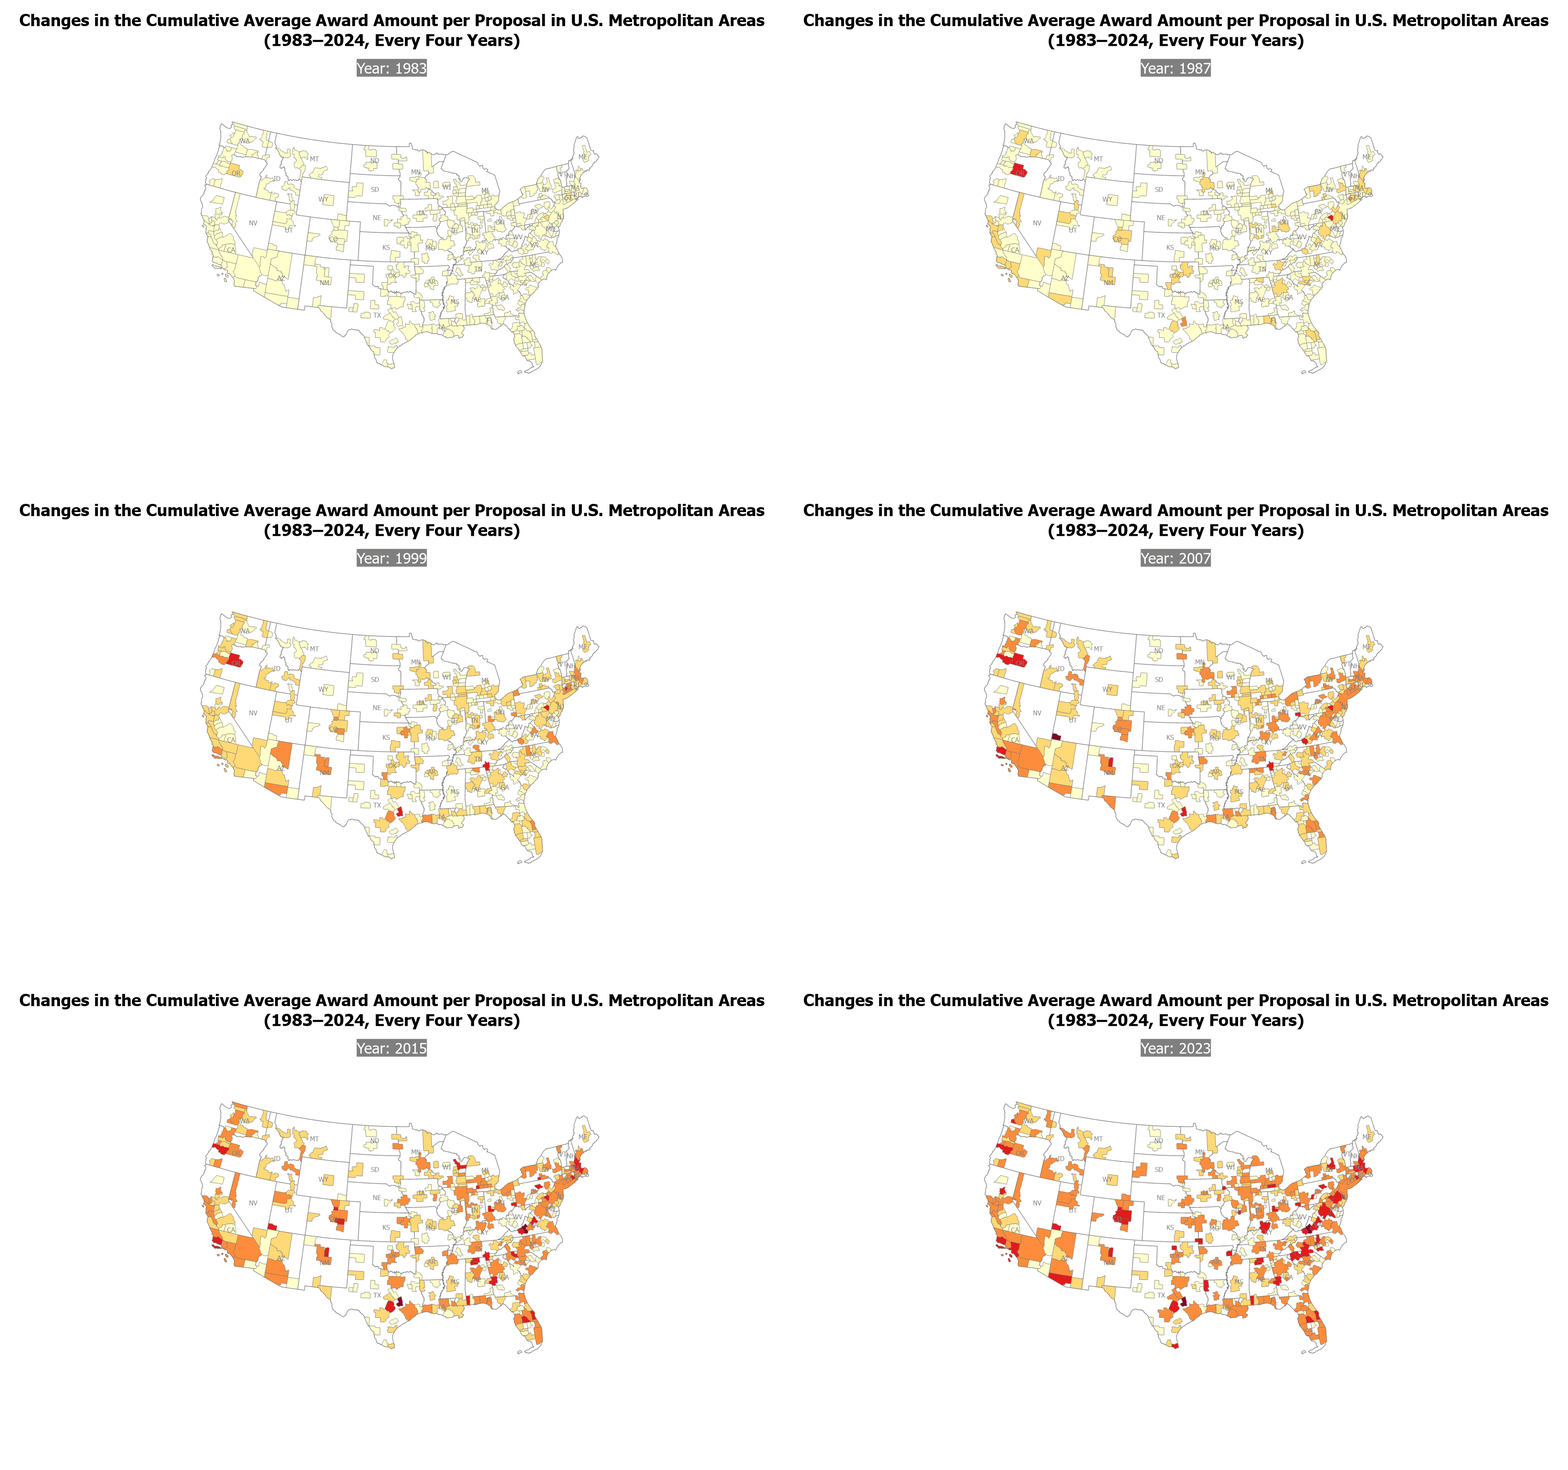 ⊕
Choropleth animation depicting the running average SBIC award per proposal for each U.S. metropolitan area from 1983 to 2024, updated every four years.