Projects
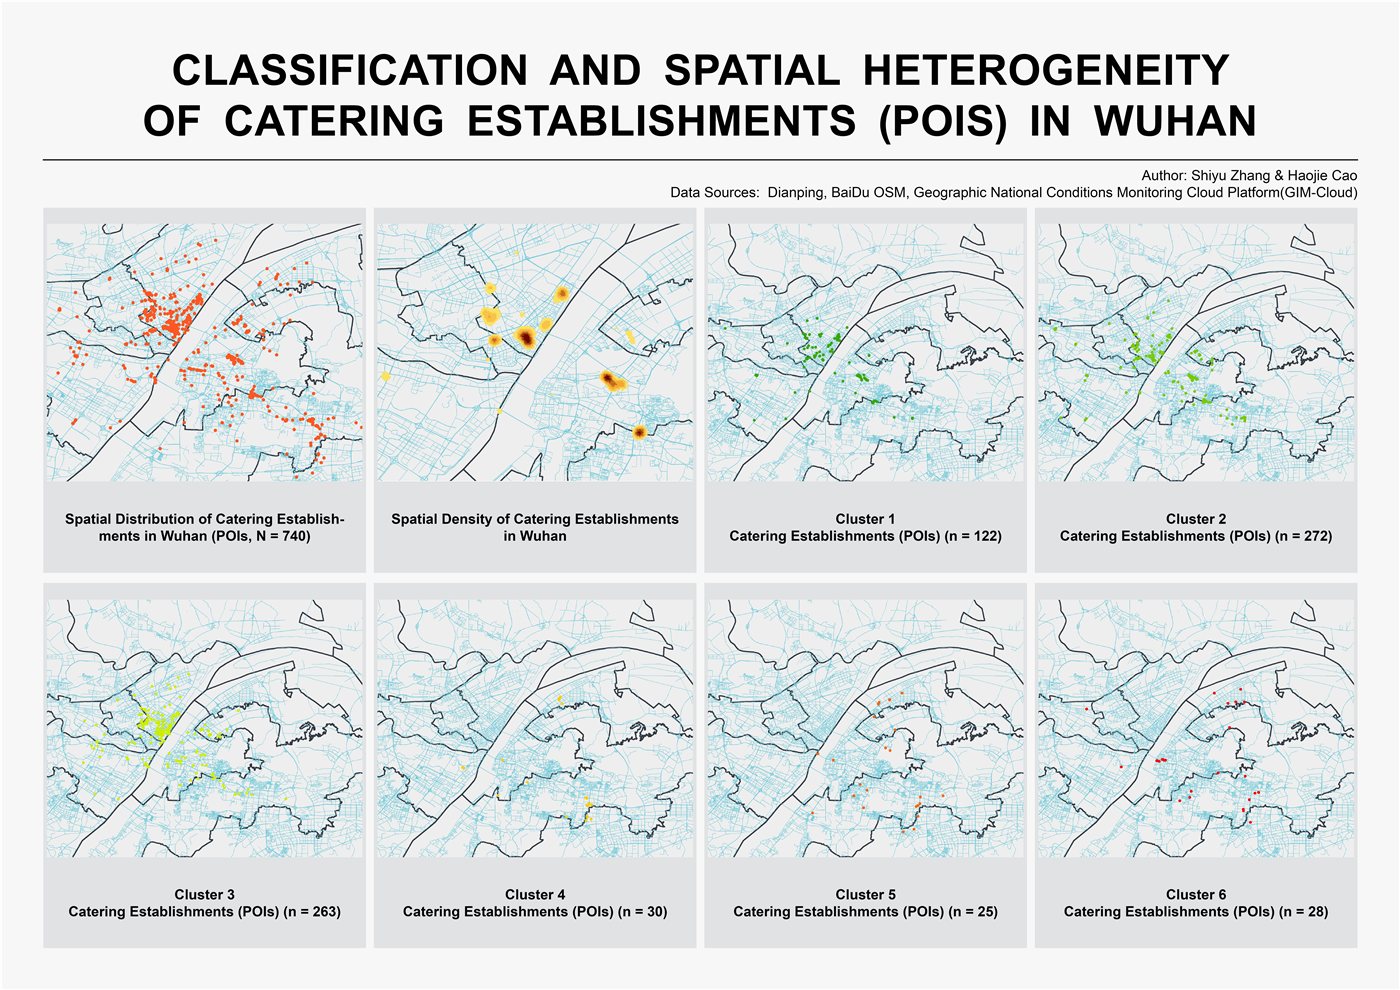 ⊕
This project investigates the spatial distribution and clustering patterns of food and beverage establishments across Wuhan's urban core. Drawing on point-of-interest (POI) data collected from Dianping and OpenStreetMap, the study examines where restaurants, cafes, and food vendors cluster, revealing what those patterns suggest about urban commercial geography.
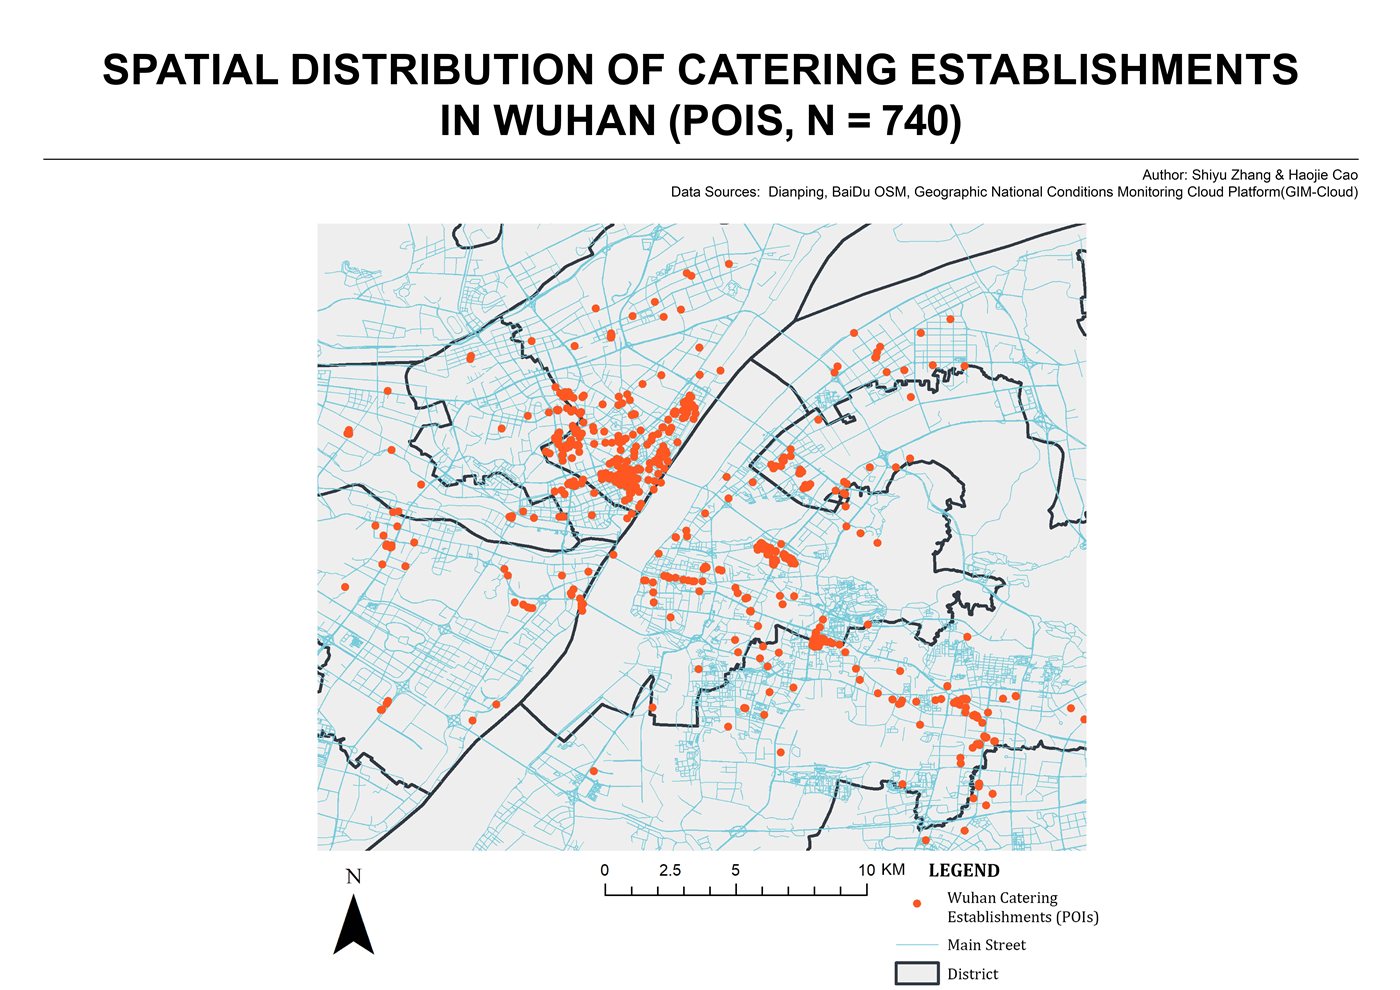
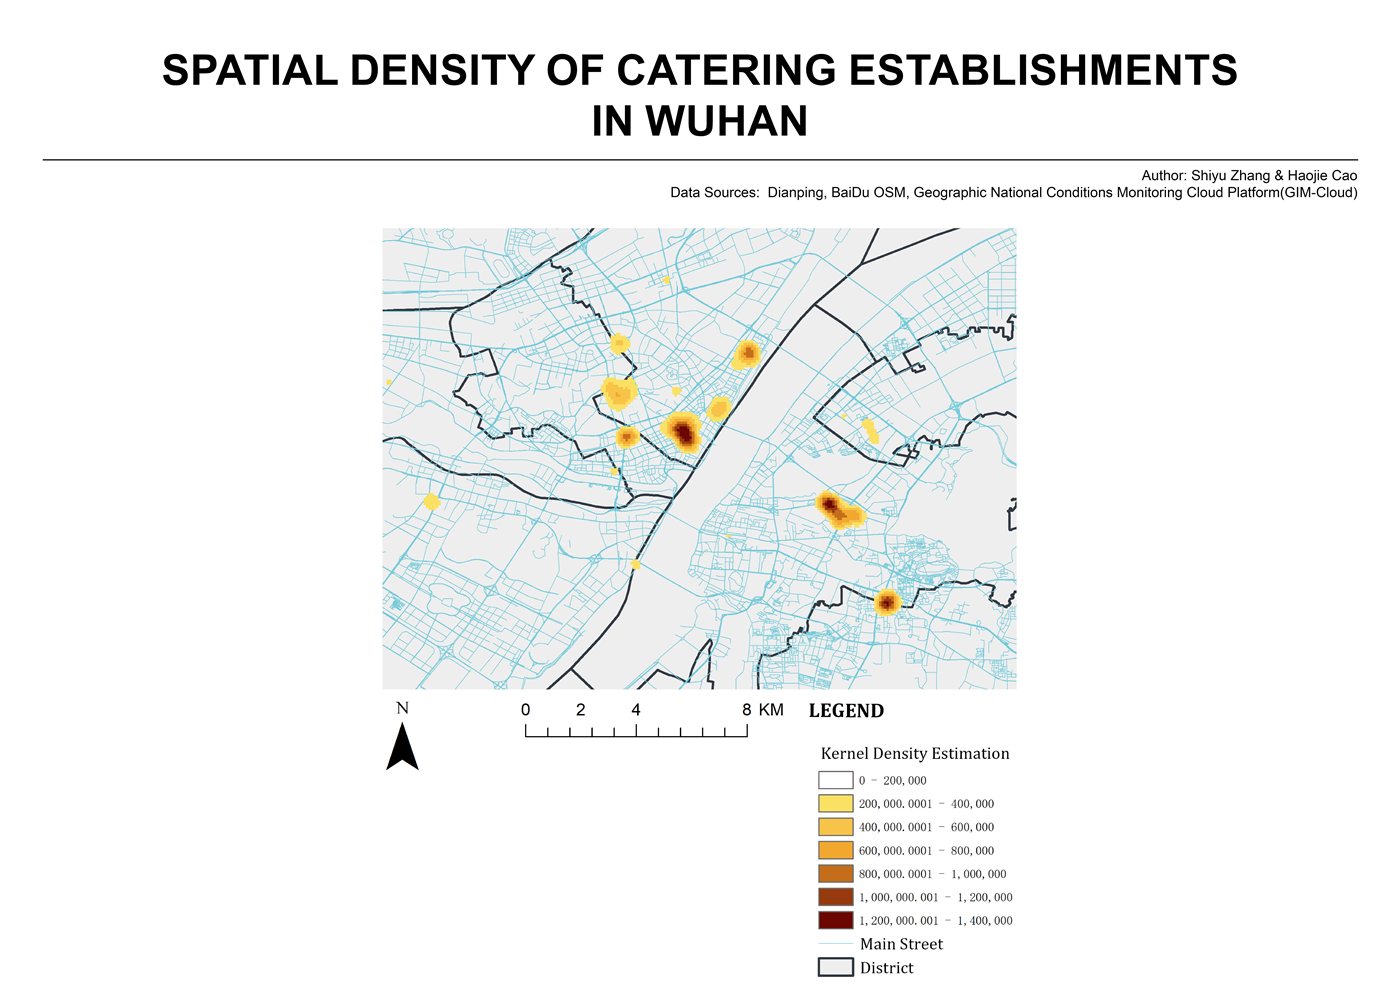
740 catering establishments were geocoded and mapped as point data. Kernel Density Estimation (KDE) was applied to identify high-density zones, while spatial classification methods including DBSCAN clustering were used to segment POIs into six distinct spatial clusters, distinguishing hotspots from outlier distributions across districts.
Results show strong clustering in established commercial corridors and entertainment districts (Clusters 2 and 3 account for 72% of POIs), with notable spatial heterogeneity between inner-ring dense clusters and scattered outer-ring establishments. Findings suggest catering density correlates with transit accessibility and mixed-use zoning patterns.
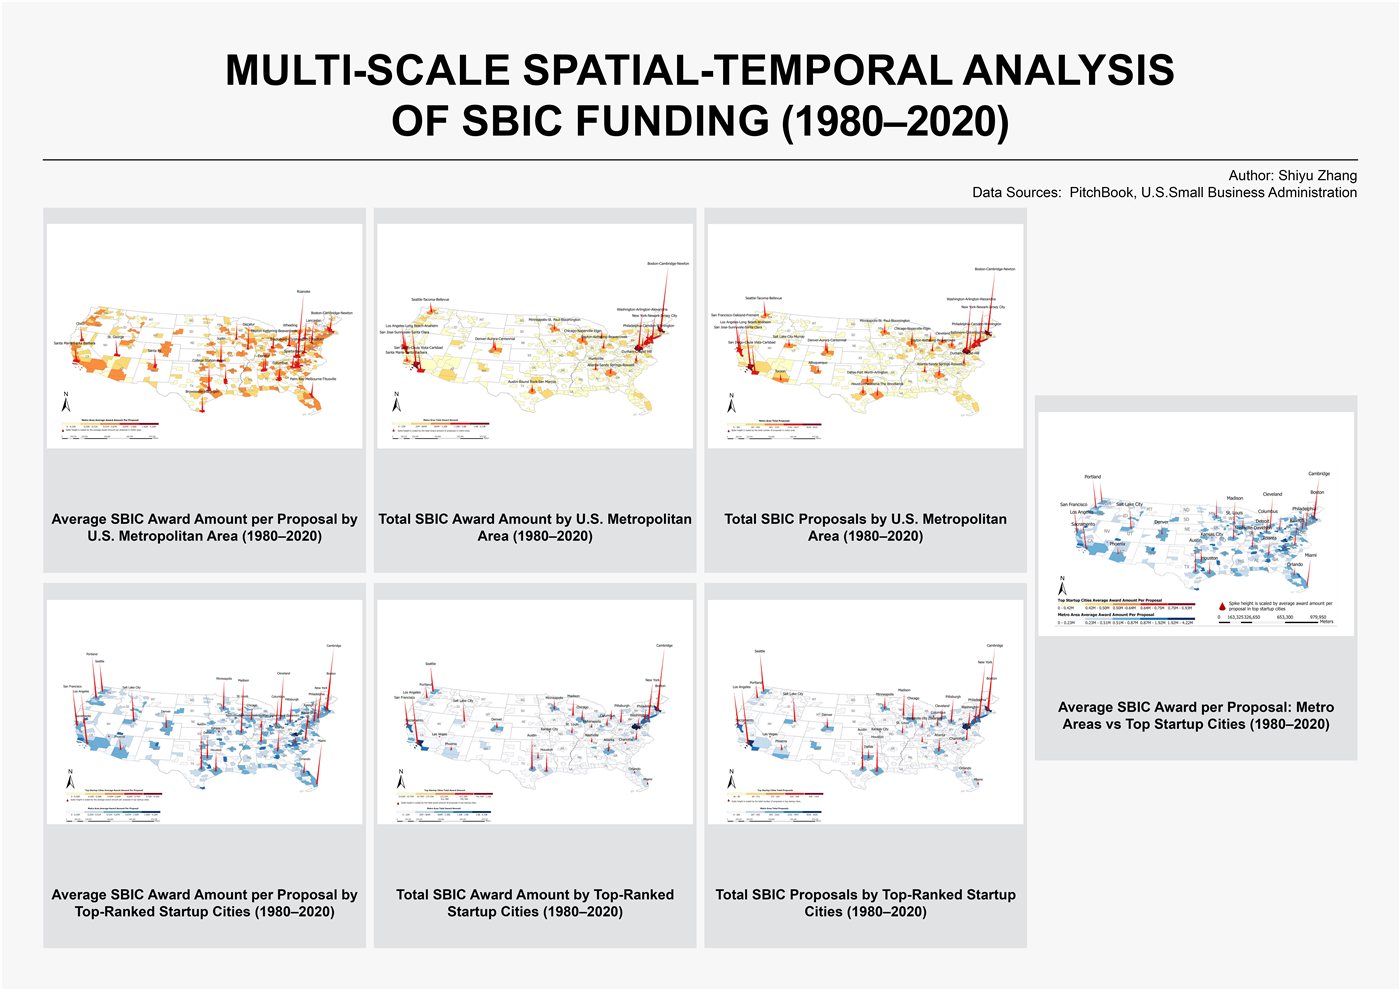 ⊕
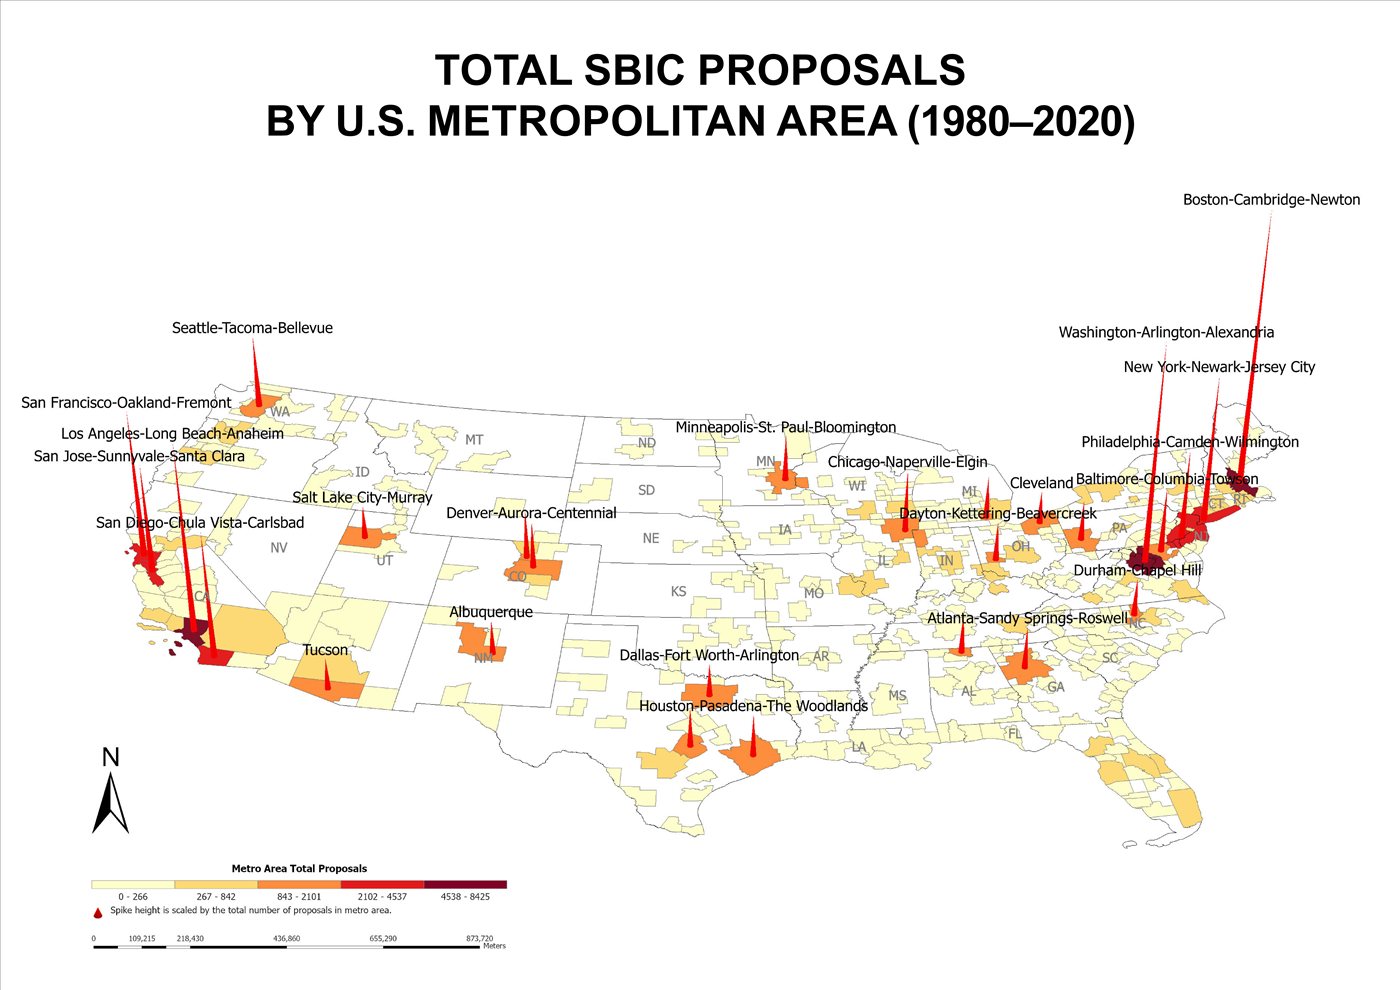
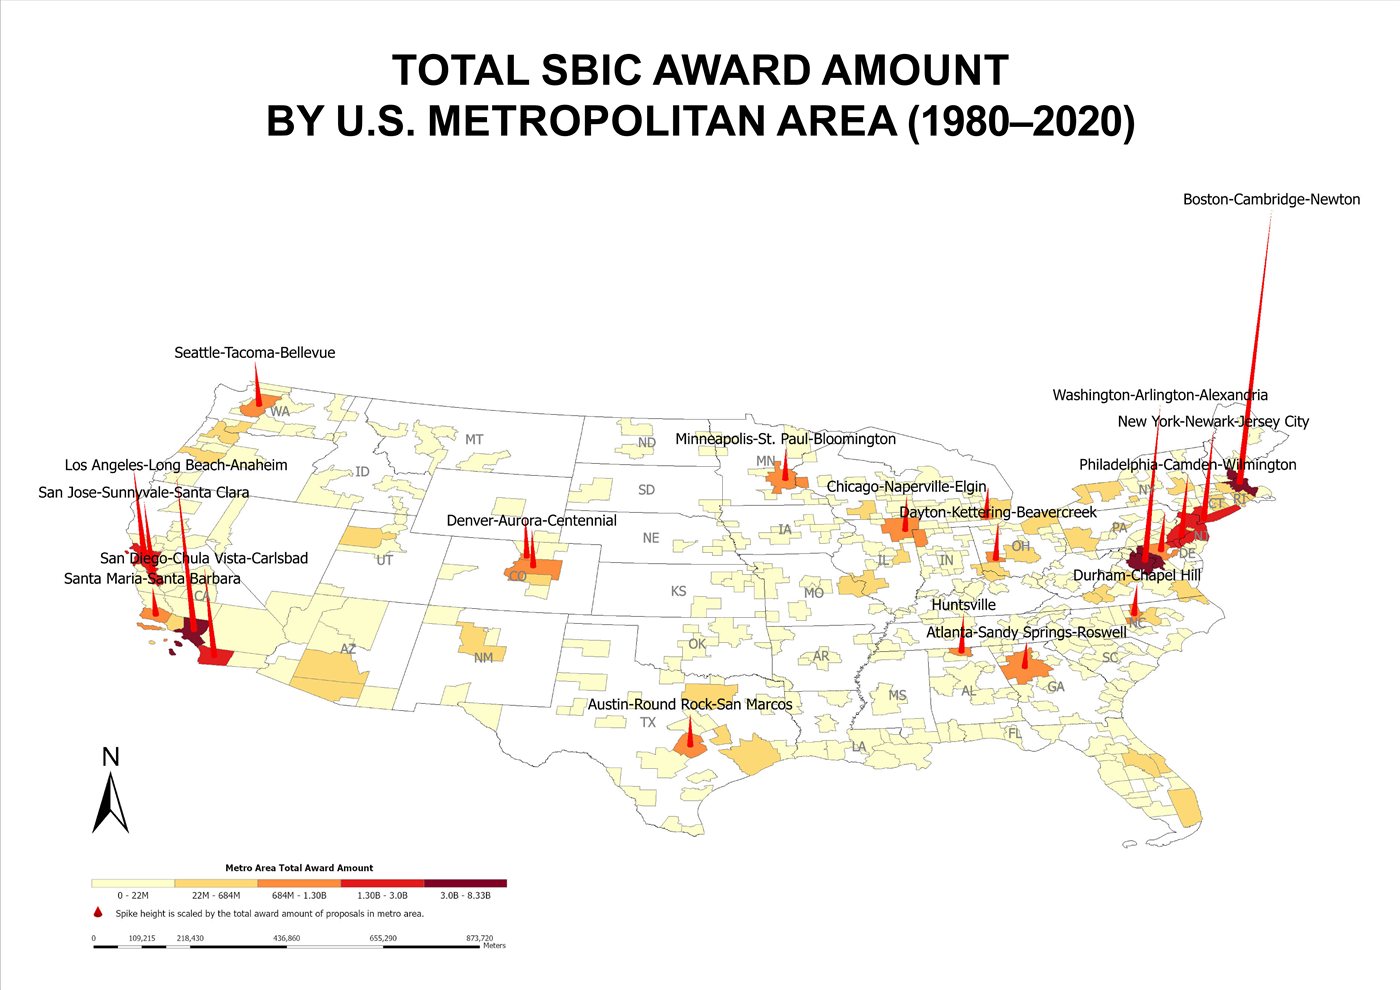
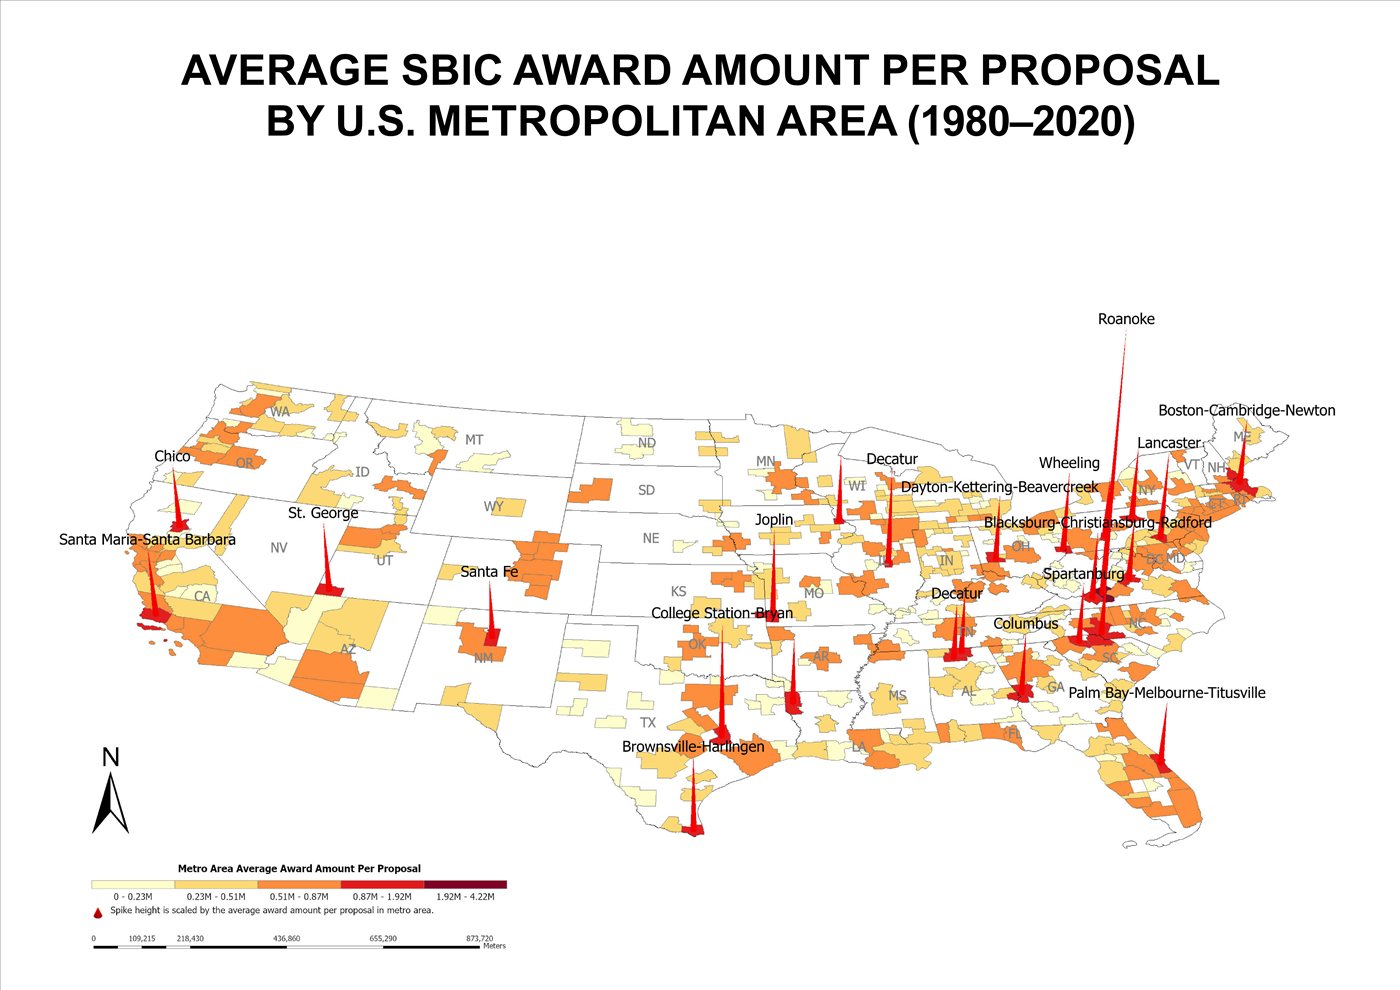
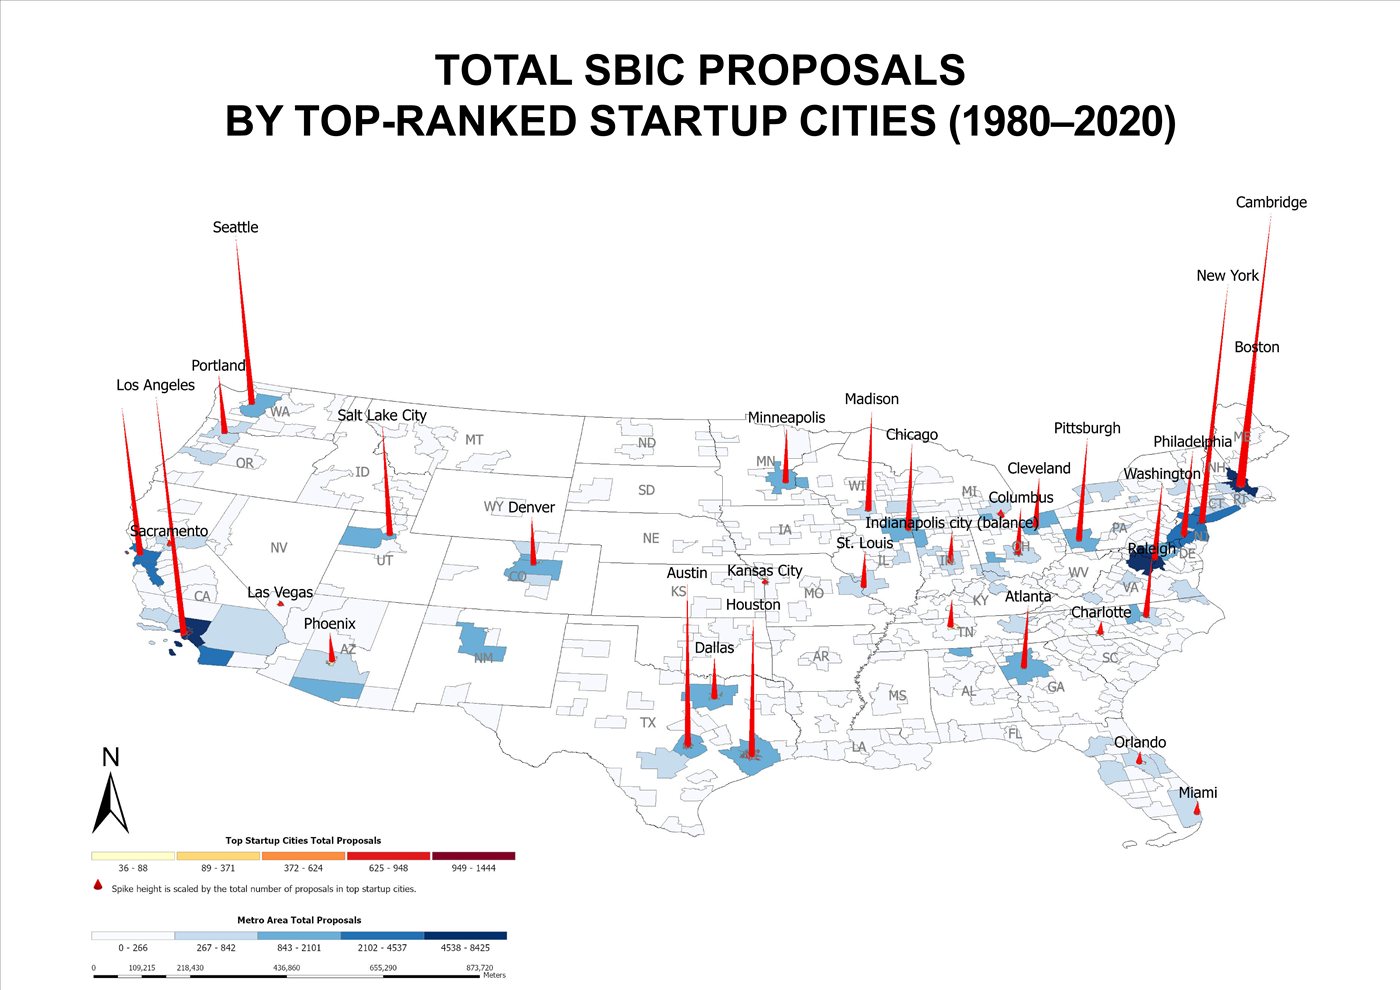
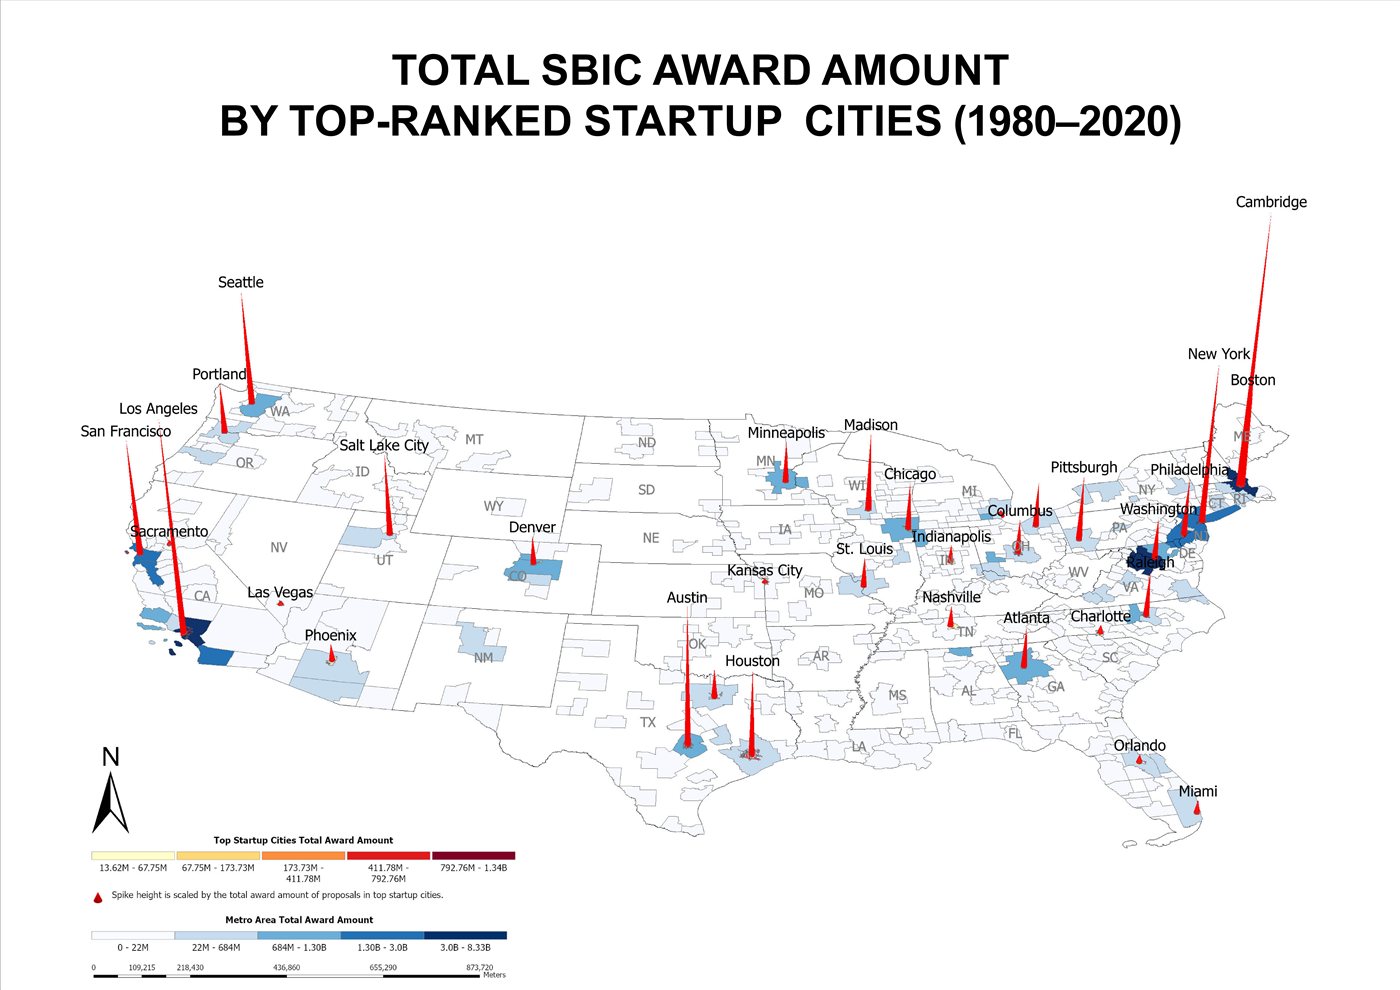
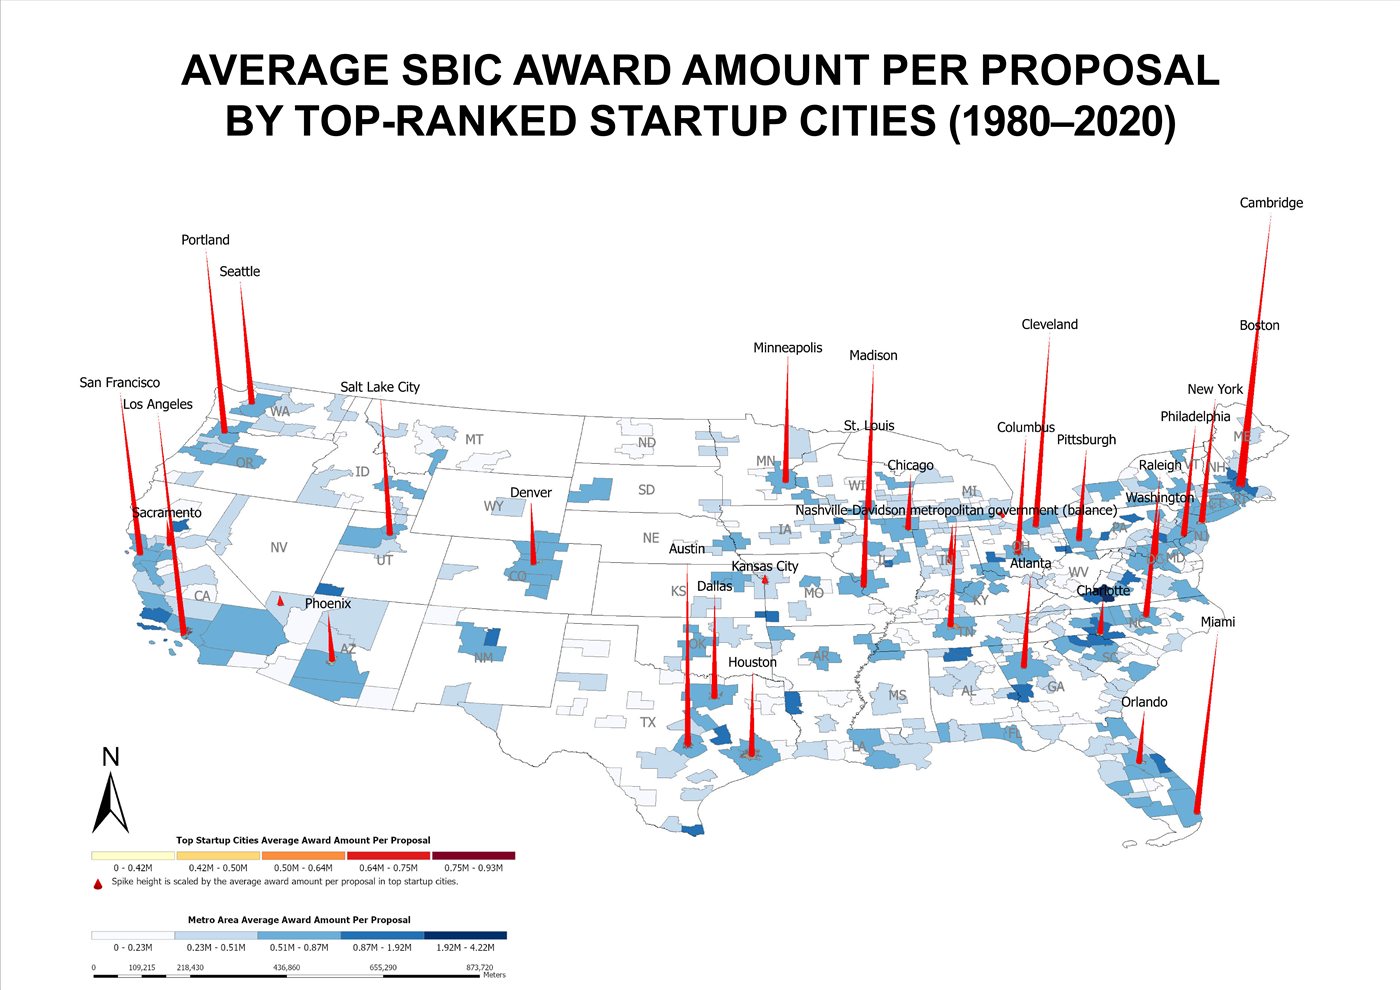
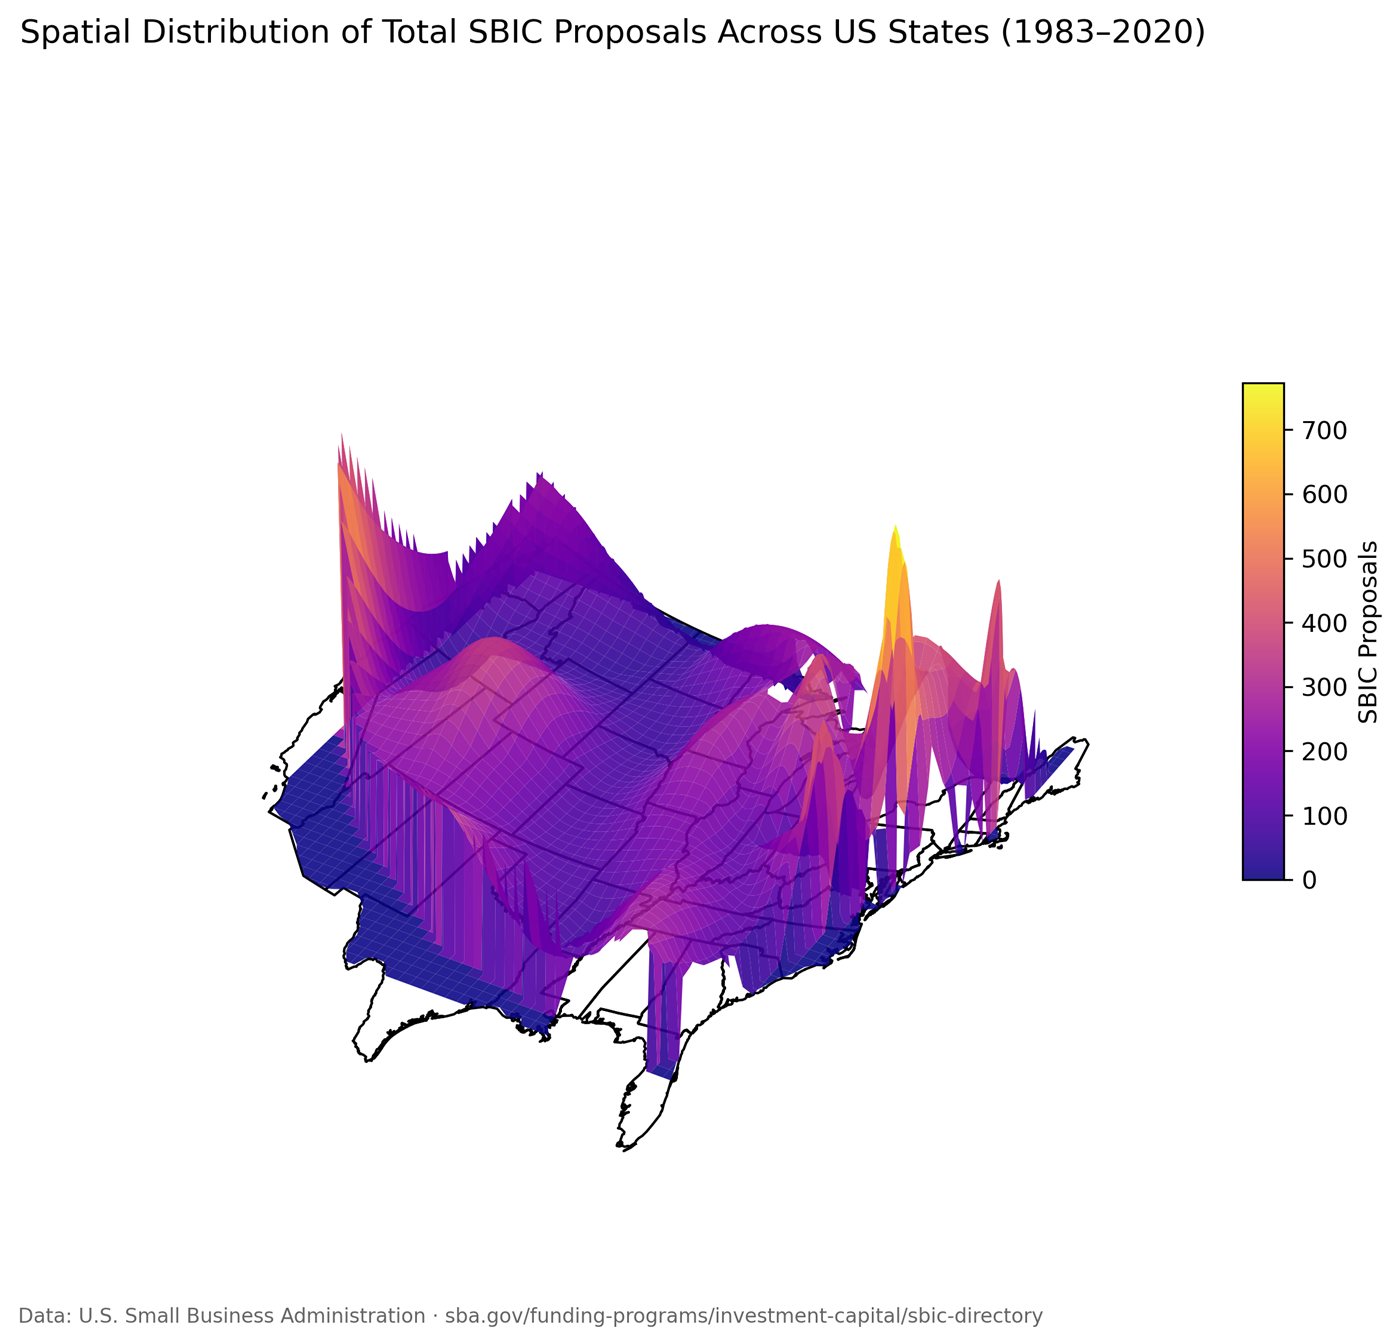
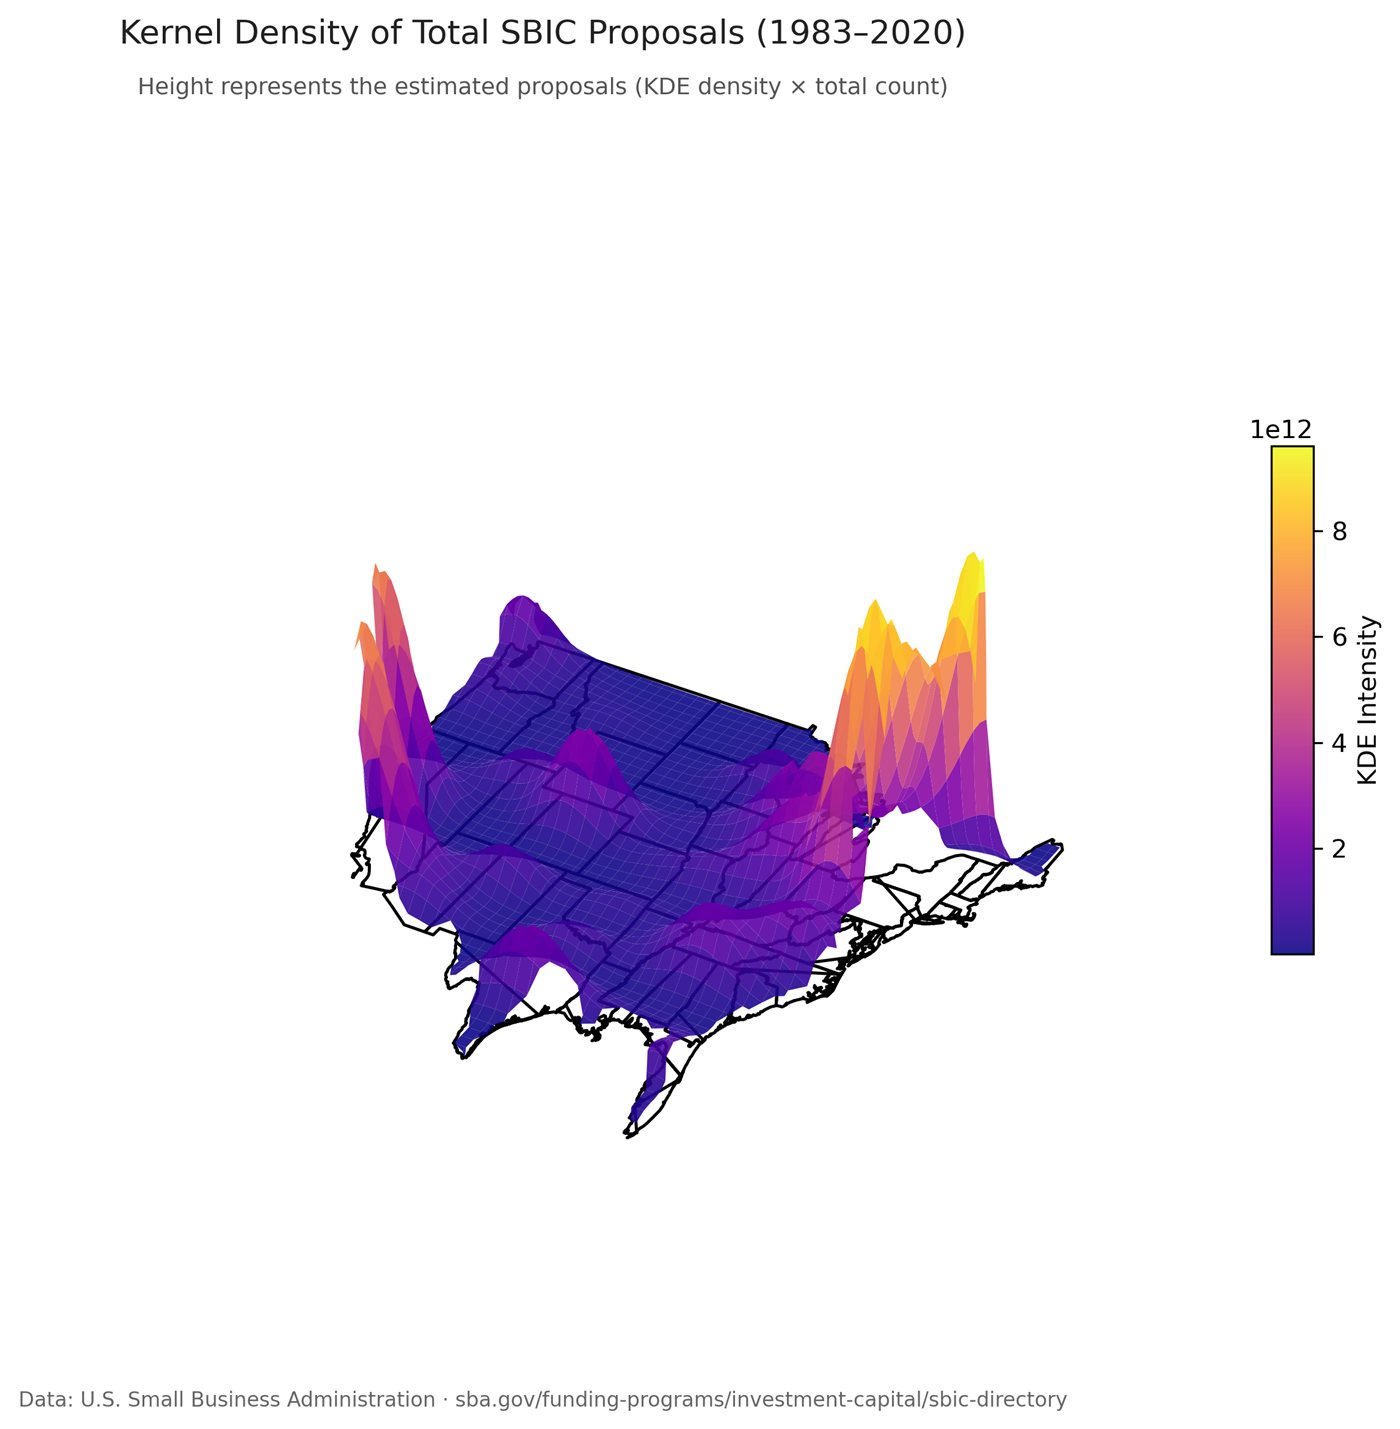
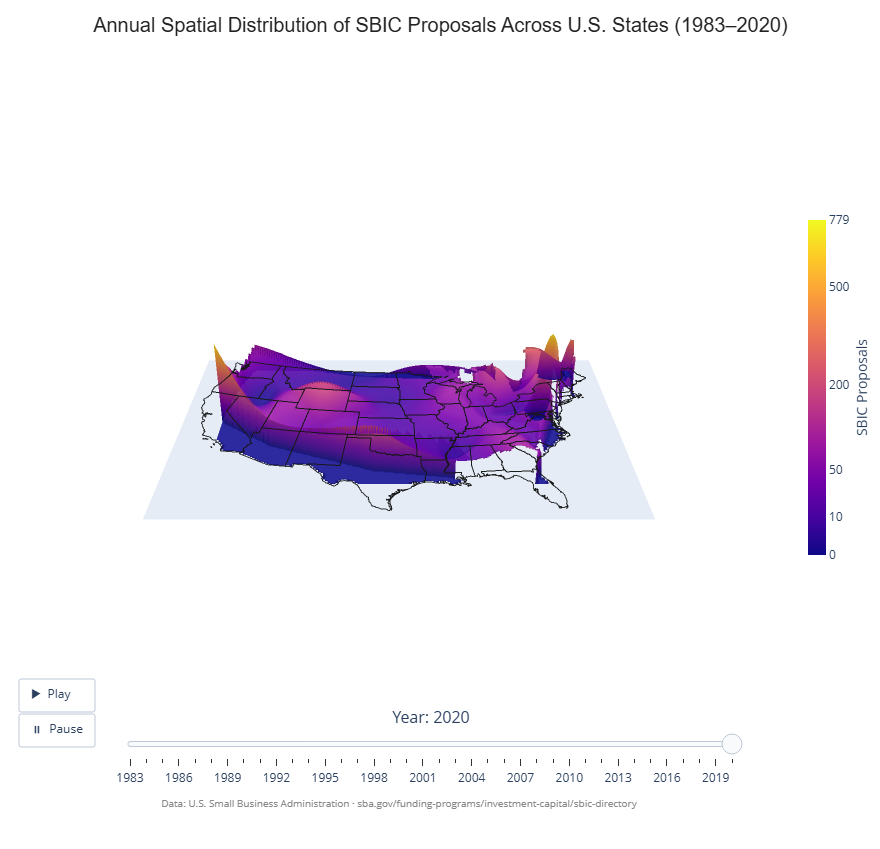
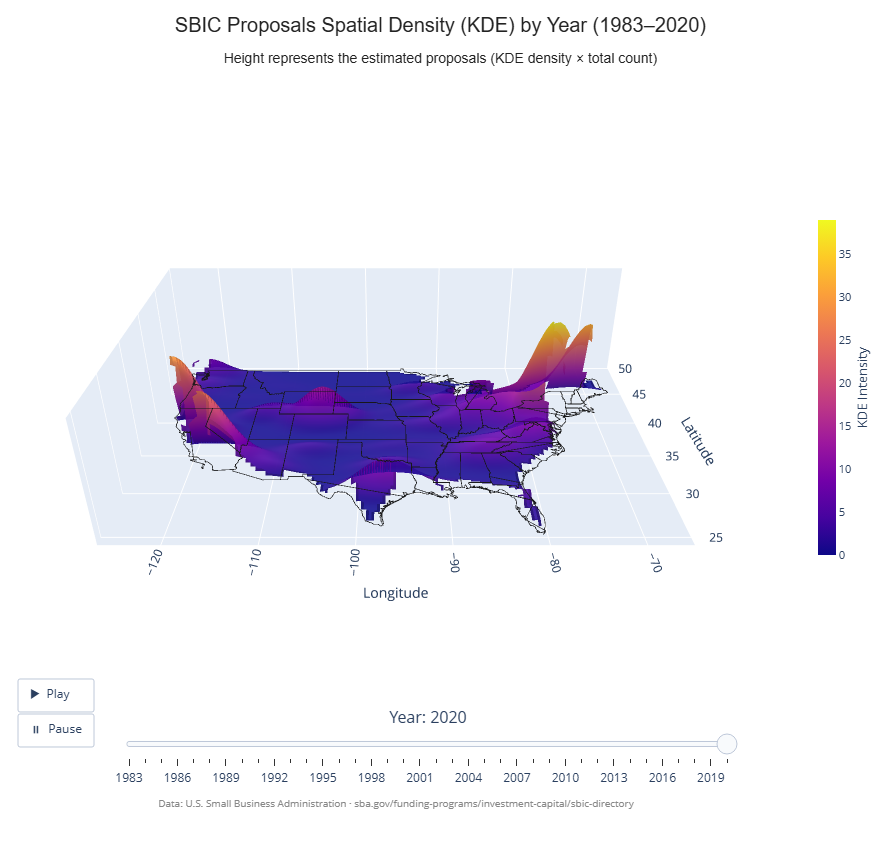
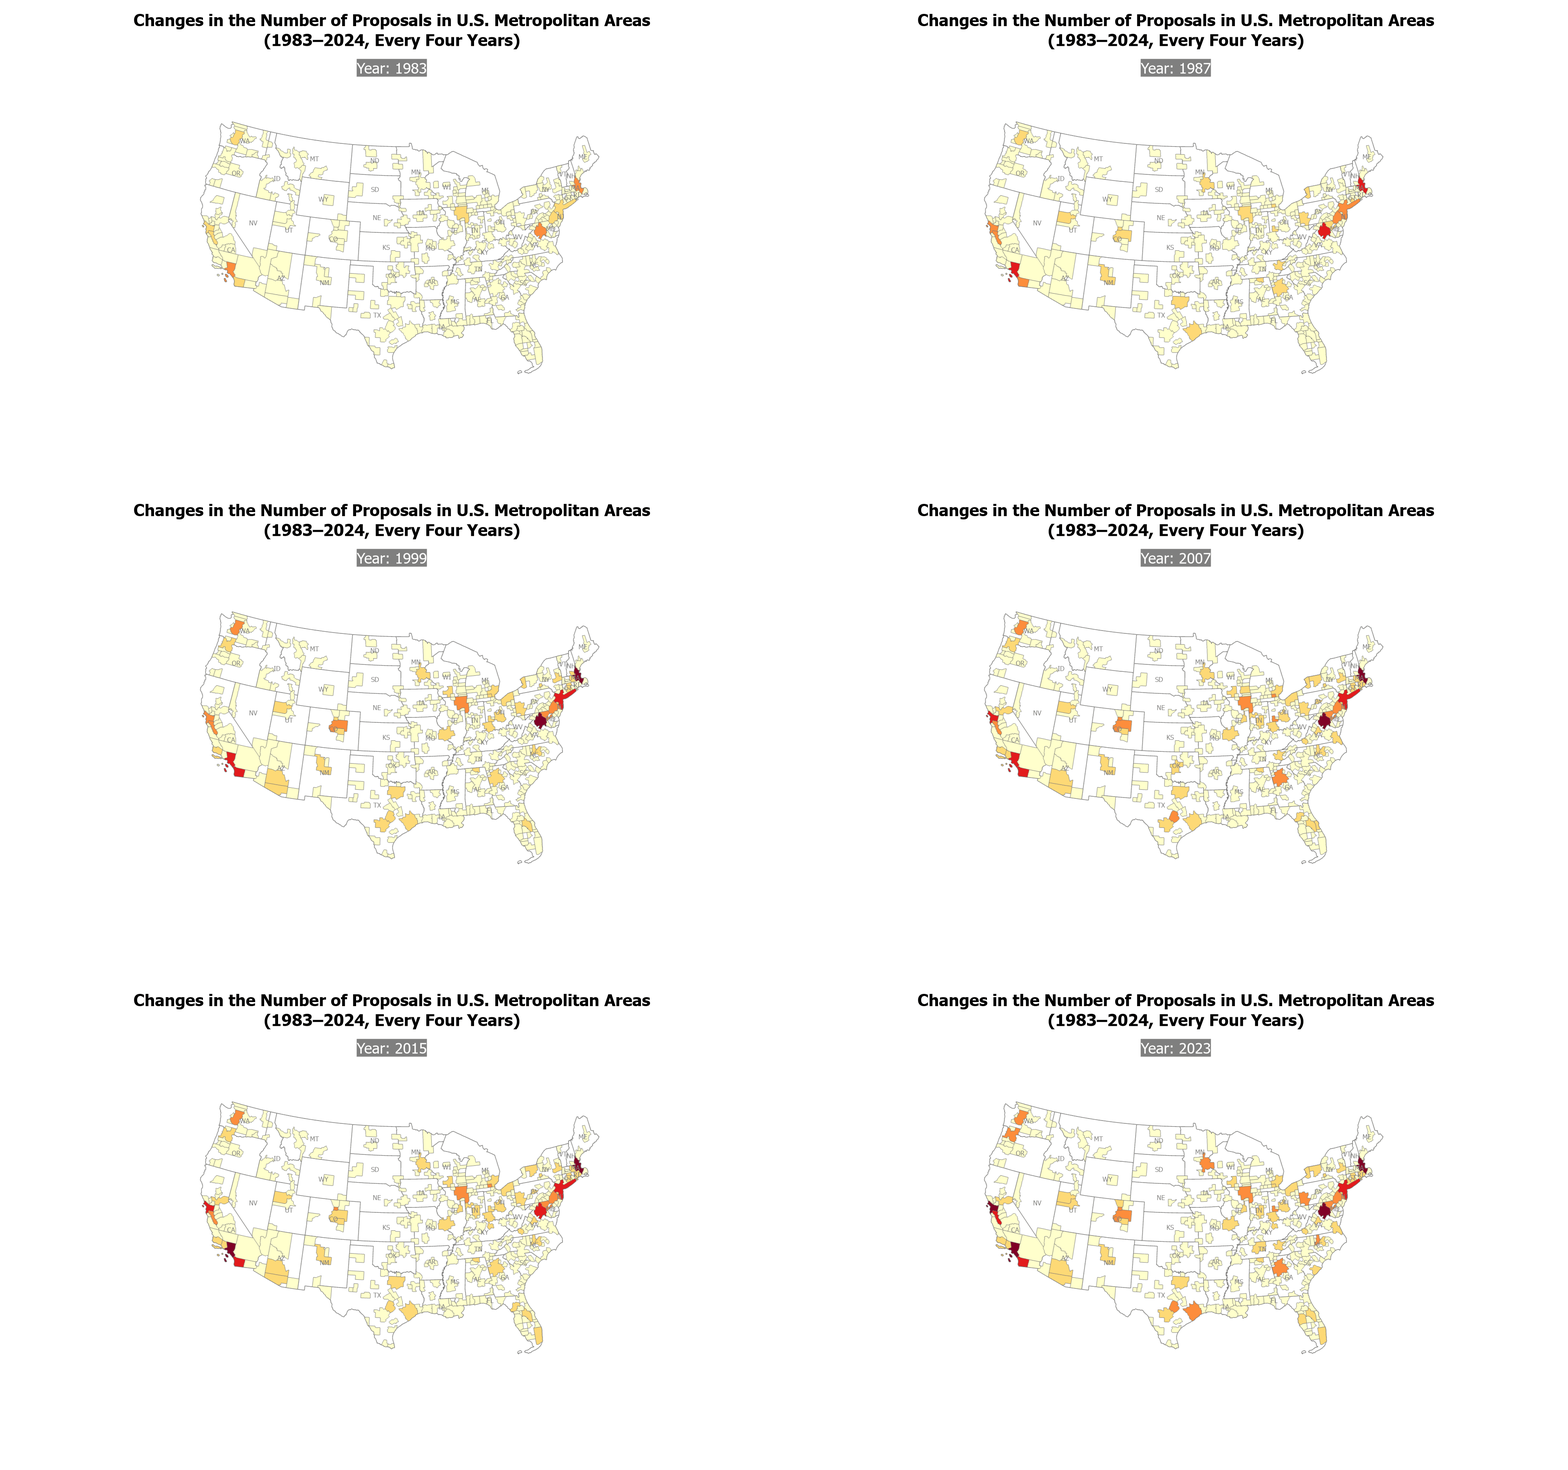
This project presents a multi-scale spatial-temporal analysis of Small Business Investment Company (SBIC) proposals and awards across the United States from 1980 to 2020, exploring how federal venture capital distributed through SBICs has evolved geographically over four decades and how these patterns relate to major innovation hubs and leading startup cities.
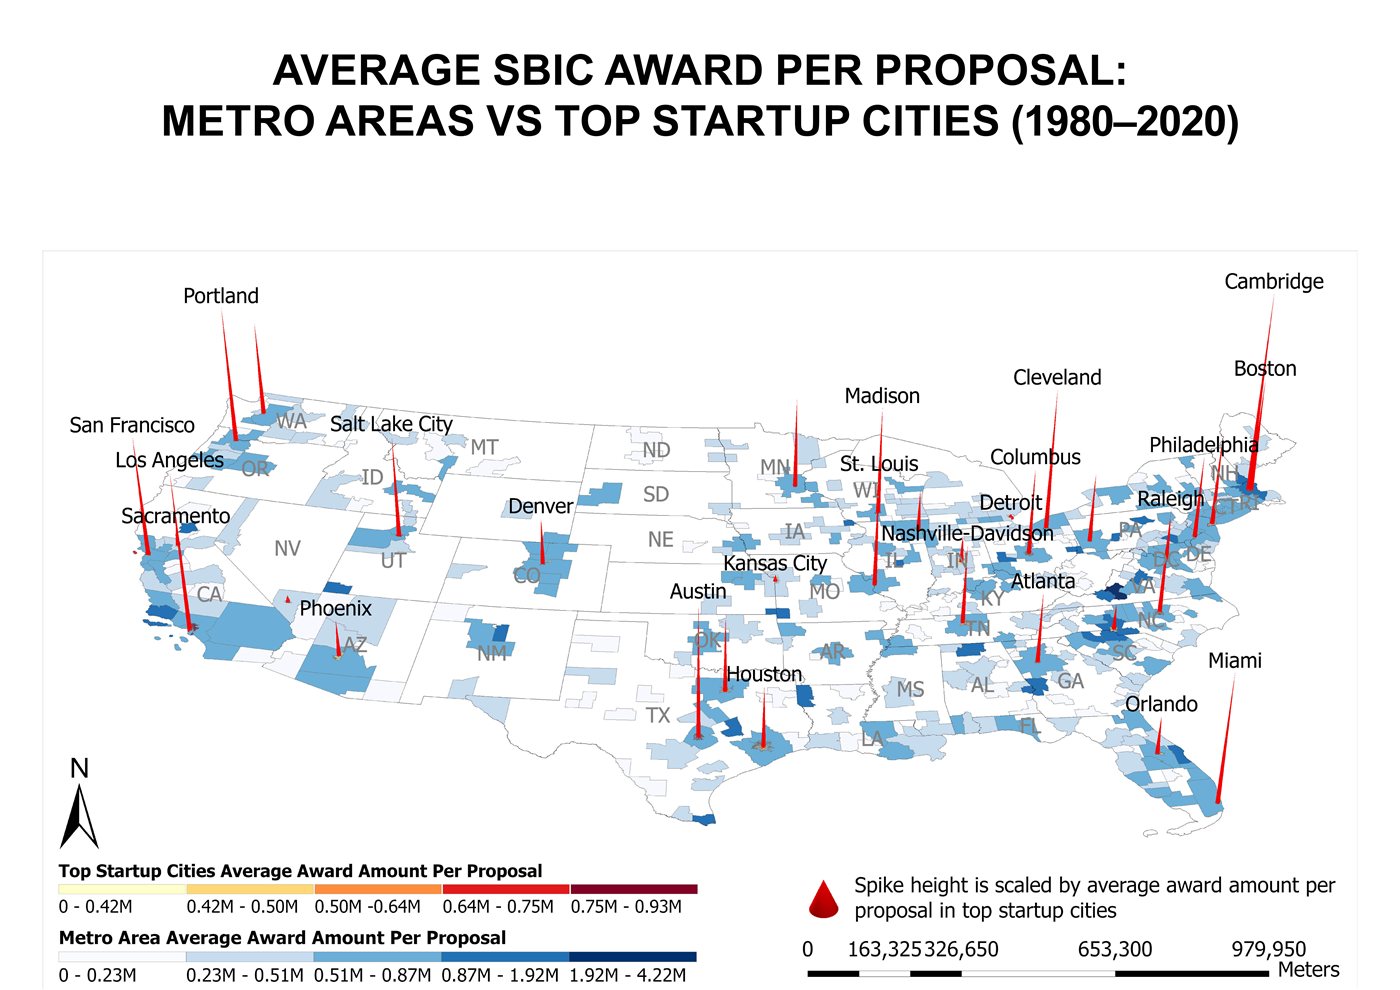
Cartographic visualization spans two spatial scales: U.S. metropolitan areas and top-ranked Startup cities. Each scale is mapped across three metrics: average award per proposal, total proposals, and total award amount, producing six thematic maps. A seventh comparative map contrasts metropolitan patterns against top startup cities. Proportional spike symbols are overlaid on choropleth backgrounds throughout.
Funding is heavily concentrated in coastal innovation hubs including California (San Francisco, Los Angeles), New York, and Massachusetts (Boston, Cambridge), across all metrics and time periods. At the Startup cities scale, Cambridge and Boston consistently lead in average award per proposal, while the comparative map reveals widening geographic disparities between startup cities and their surrounding metro areas after 2000.